Peruvian groundcherry vs. Mandarin orange — In-Depth Nutrition Comparison
Compare
What are the main differences between Peruvian groundcherry and mandarin oranges?
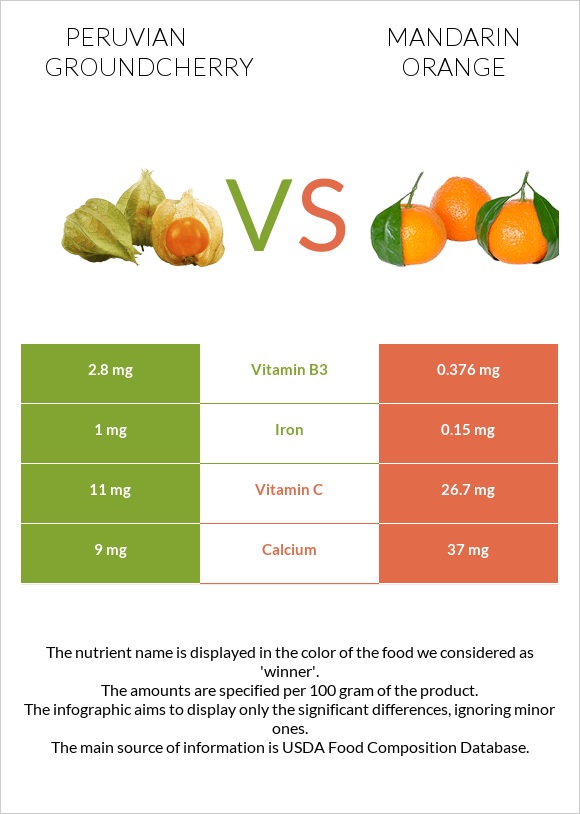
- Peruvian groundcherry is richer in vitamin B3 and iron, while mandarin oranges are higher in vitamin C.
- Mandarin oranges' daily need coverage for vitamin C is 17% higher.
- Mandarin oranges have 7 times less vitamin B3 than Peruvian groundcherry. Peruvian groundcherry has 2.8mg of vitamin B3, while mandarin oranges have 0.376mg.
- Mandarin oranges have a higher glycemic index (47) than Peruvian groundcherry (35).
We used Groundcherries, (cape-gooseberries or poha), raw and Tangerines, (mandarin oranges), raw types in this comparison.
Infographic
Infographic link
Mineral Comparison
Mineral comparison score is based on the number of minerals by which one or the other food is richer. The "coverage" charts below show how much of the daily needs can be covered by 300 grams of the food.
| Contains more IronIron | +566.7% |
| Contains more PhosphorusPhosphorus | +100% |
| Contains less SodiumSodium | -100% |
| Contains more CalciumCalcium | +311.1% |
Vitamin Comparison
Vitamin comparison score is based on the number of vitamins by which one or the other food is richer. The "coverage" charts below show how much of the daily needs can be covered by 300 grams of the food.
| Contains more Vitamin B1Vitamin B1 | +89.7% |
| Contains more Vitamin B3Vitamin B3 | +644.7% |
| Contains more Vitamin CVitamin C | +142.7% |
All nutrients comparison - raw data values
| Nutrient |  |
 |
DV% diff. |
| Vitamin C | 11mg | 26.7mg | 17% |
| Vitamin B3 | 2.8mg | 0.376mg | 15% |
| Iron | 1mg | 0.15mg | 11% |
| Fiber | 1.8g | 7% | |
| Vitamin B6 | 0.078mg | 6% | |
| Potassium | 166mg | 5% | |
| Copper | 0.042mg | 5% | |
| Vitamin B1 | 0.11mg | 0.058mg | 4% |
| Vitamin B5 | 0.216mg | 4% | |
| Folate | 16µg | 4% | |
| Magnesium | 12mg | 3% | |
| Calcium | 9mg | 37mg | 3% |
| Phosphorus | 40mg | 20mg | 3% |
| Fructose | 2.4g | 3% | |
| Protein | 1.9g | 0.81g | 2% |
| Manganese | 0.039mg | 2% | |
| Choline | 10.2mg | 2% | |
| Fats | 0.7g | 0.31g | 1% |
| Carbs | 11.2g | 13.34g | 1% |
| Zinc | 0.07mg | 1% | |
| Vitamin E | 0.2mg | 1% | |
| Calories | 53kcal | 53kcal | 0% |
| Protein per 100 calories | 3.6g | 1.5g | N/A |
| Calories per 10 g protein | 279kcal | 654kcal | N/A |
| Weight per 100 calories | 189g | 189g | N/A |
| Net carbs | 11.2g | 11.54g | N/A |
| Sugar | 10.58g | N/A | |
| Sodium | 2mg | 0% | |
| Vitamin A | 36µg | 34µg | 0% |
| Selenium | 0.1µg | 0% | |
| Vitamin B2 | 0.04mg | 0.036mg | 0% |
| Saturated fat | 0.039g | 0% | |
| Monounsaturated fat | 0.06g | 0% | |
| Polyunsaturated fat | 0.065g | 0% | |
| Tryptophan | 0.002mg | 0% | |
| Threonine | 0.016mg | 0% | |
| Isoleucine | 0.017mg | 0% | |
| Leucine | 0.028mg | 0% | |
| Lysine | 0.032mg | 0% | |
| Methionine | 0.002mg | 0% | |
| Phenylalanine | 0.018mg | 0% | |
| Valine | 0.021mg | 0% | |
| Histidine | 0.011mg | 0% |
Macronutrient Comparison
Macronutrient breakdown side-by-side comparison
Protein:
1.9 g
Fats:
0.7 g
Carbs:
11.2 g
Water:
85.4 g
Other:
0.8 g
Protein:
0.81 g
Fats:
0.31 g
Carbs:
13.34 g
Water:
85.17 g
Other:
0.37 g
| Contains more ProteinProtein | +134.6% |
| Contains more FatsFats | +125.8% |
| Contains more OtherOther | +116.2% |
| Contains more CarbsCarbs | +19.1% |
~equal in
Water
~85.17g


