Peruvian groundcherry vs. Flax seeds — In-Depth Nutrition Comparison
Compare
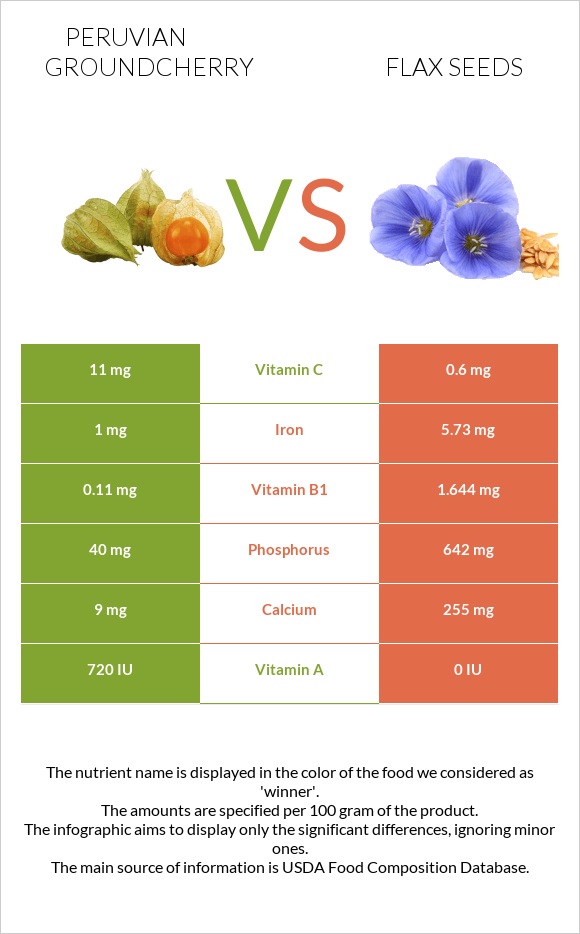
How are Peruvian groundcherry and flax seeds different?
- Peruvian groundcherry is richer in vitamin A and vitamin C, while flax seeds are higher in vitamin B1, phosphorus, iron, calcium, and vitamin B2.
- Flax seeds cover your daily need for vitamin B1, 128% more than Peruvian groundcherry.
Groundcherries, (cape-gooseberries or poha), raw and Seeds, flaxseed types were used in this article.
Infographic
Infographic link
Mineral Comparison
Mineral comparison score is based on the number of minerals by which one or the other food is richer. The "coverage" charts below show how much of the daily needs can be covered by 300 grams of the food.
| Contains less SodiumSodium | -100% |
| Contains more CalciumCalcium | +2733.3% |
| Contains more IronIron | +473% |
| Contains more PhosphorusPhosphorus | +1505% |
Vitamin Comparison
Vitamin comparison score is based on the number of vitamins by which one or the other food is richer. The "coverage" charts below show how much of the daily needs can be covered by 300 grams of the food.
| Contains more Vitamin CVitamin C | +1733.3% |
| Contains more Vitamin AVitamin A | +∞% |
| Contains more Vitamin B1Vitamin B1 | +1394.5% |
| Contains more Vitamin B2Vitamin B2 | +302.5% |
All nutrients comparison - raw data values
| Nutrient |  |
 |
DV% diff. |
| Polyunsaturated fat | 28.73g | 192% | |
| Copper | 1.22mg | 136% | |
| Vitamin B1 | 0.11mg | 1.644mg | 128% |
| Fiber | 27.3g | 109% | |
| Manganese | 2.482mg | 108% | |
| Magnesium | 392mg | 93% | |
| Phosphorus | 40mg | 642mg | 86% |
| Fats | 0.7g | 42.16g | 64% |
| Iron | 1mg | 5.73mg | 59% |
| Selenium | 25.4µg | 46% | |
| Zinc | 4.34mg | 39% | |
| Vitamin B6 | 0.473mg | 36% | |
| Protein | 1.9g | 18.29g | 33% |
| Calcium | 9mg | 255mg | 25% |
| Calories | 53kcal | 534kcal | 24% |
| Potassium | 813mg | 24% | |
| Folate | 87µg | 22% | |
| Vitamin B5 | 0.985mg | 20% | |
| Monounsaturated fat | 7.527g | 19% | |
| Saturated fat | 3.663g | 17% | |
| Choline | 78.7mg | 14% | |
| Vitamin C | 11mg | 0.6mg | 12% |
| Vitamin B2 | 0.04mg | 0.161mg | 9% |
| Carbs | 11.2g | 28.88g | 6% |
| Vitamin A | 36µg | 0µg | 4% |
| Vitamin K | 4.3µg | 4% | |
| Vitamin E | 0.31mg | 2% | |
| Vitamin B3 | 2.8mg | 3.08mg | 2% |
| Sodium | 30mg | 1% | |
| Net carbs | 11.2g | 1.58g | N/A |
| Sugar | 1.55g | N/A | |
| Tryptophan | 0.297mg | 0% | |
| Threonine | 0.766mg | 0% | |
| Isoleucine | 0.896mg | 0% | |
| Leucine | 1.235mg | 0% | |
| Lysine | 0.862mg | 0% | |
| Methionine | 0.37mg | 0% | |
| Phenylalanine | 0.957mg | 0% | |
| Valine | 1.072mg | 0% | |
| Histidine | 0.472mg | 0% | |
| Omega-6 - Eicosadienoic acid | 0.007g | N/A |
Macronutrient Comparison
Macronutrient breakdown side-by-side comparison
Protein:
1.9 g
Fats:
0.7 g
Carbs:
11.2 g
Water:
85.4 g
Other:
0.8 g
Protein:
18.29 g
Fats:
42.16 g
Carbs:
28.88 g
Water:
6.96 g
Other:
3.71 g
| Contains more WaterWater | +1127% |
| Contains more ProteinProtein | +862.6% |
| Contains more FatsFats | +5922.9% |
| Contains more CarbsCarbs | +157.9% |
| Contains more OtherOther | +363.8% |


