Pie crust, cookie-type, prepared from recipe, vanilla wafer, chilled vs. Doughnuts — In-Depth Nutrition Comparison
Compare
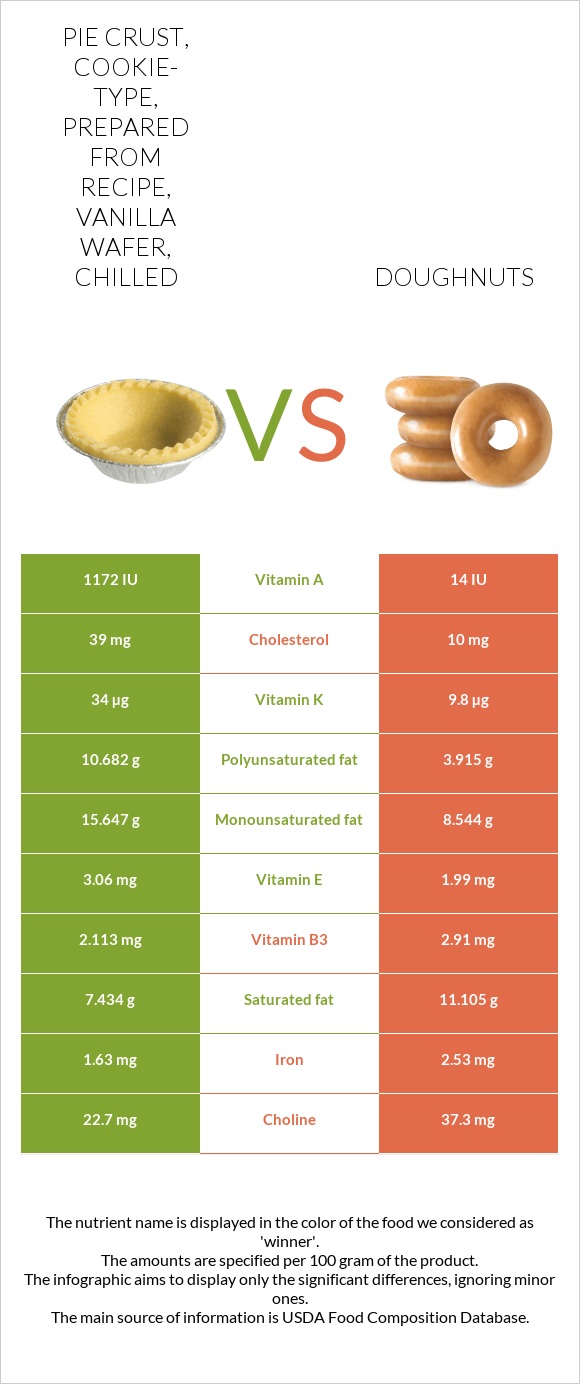
How are pie crust, cookie-type, prepared from recipe, vanilla wafer, chilled and doughnuts different?
- Pie crust, cookie-type, prepared from recipe, vanilla wafer, chilled is higher in vitamin A, vitamin K, and vitamin E; however, doughnuts are richer in phosphorus, vitamin B1, iron, folate, and manganese.
- Daily need coverage for phosphorus for doughnuts is 26% higher.
- Pie crust, cookie-type, prepared from recipe, vanilla wafer, chilled contains 84 times more vitamin A than doughnuts. While pie crust, cookie-type, prepared from recipe, vanilla wafer, chilled contains 1172 IU of vitamin A, doughnuts contain only 14 IU.
- Doughnuts have less cholesterol.
Pie crust, cookie-type, prepared from recipe, vanilla wafer, chilled and Doughnuts, cake-type, plain (includes unsugared, old-fashioned) are the varieties used in this article.
Infographic
Infographic link
Mineral Comparison
Mineral comparison score is based on the number of minerals by which one or the other food is richer. The "coverage" charts below show how much of the daily needs can be covered by 300 grams of the food.
| Contains more MagnesiumMagnesium | +70% |
| Contains more PotassiumPotassium | +69.6% |
| Contains more IronIron | +55.2% |
| Contains more CopperCopper | +32.4% |
| Contains more ZincZinc | +108.3% |
| Contains more PhosphorusPhosphorus | +233.3% |
| Contains more ManganeseManganese | +87.1% |
| Contains more SeleniumSelenium | +31.2% |
Vitamin Comparison
Vitamin comparison score is based on the number of vitamins by which one or the other food is richer. The "coverage" charts below show how much of the daily needs can be covered by 300 grams of the food.
| Contains more Vitamin CVitamin C | +∞% |
| Contains more Vitamin DVitamin D | +∞% |
| Contains more Vitamin AVitamin A | +6625% |
| Contains more Vitamin EVitamin E | +53.8% |
| Contains more Vitamin B12Vitamin B12 | +50% |
| Contains more Vitamin KVitamin K | +246.9% |
| Contains more Vitamin B1Vitamin B1 | +106.3% |
| Contains more Vitamin B2Vitamin B2 | +31.4% |
| Contains more Vitamin B3Vitamin B3 | +37.7% |
| Contains more Vitamin B5Vitamin B5 | +23.6% |
| Contains more FolateFolate | +87.8% |
All nutrients comparison - raw data values
| Nutrient |  |
 |
DV% diff. |
| Polyunsaturated fat | 10.682g | 3.915g | 45% |
| Vitamin A | 269µg | 4µg | 29% |
| Phosphorus | 78mg | 260mg | 26% |
| Vitamin K | 34µg | 9.8µg | 20% |
| Monounsaturated fat | 15.647g | 8.544g | 18% |
| Fats | 36.2g | 24.93g | 17% |
| Vitamin B1 | 0.189mg | 0.39mg | 17% |
| Saturated fat | 7.434g | 11.105g | 17% |
| Iron | 1.63mg | 2.53mg | 11% |
| Starch | 25.91g | 11% | |
| Folate | 49µg | 92µg | 11% |
| Cholesterol | 39mg | 10mg | 10% |
| Vitamin E | 3.06mg | 1.99mg | 7% |
| Manganese | 0.178mg | 0.333mg | 7% |
| Fiber | 0.1g | 1.7g | 6% |
| Vitamin B2 | 0.229mg | 0.301mg | 6% |
| Calories | 531kcal | 434kcal | 5% |
| Vitamin B3 | 2.113mg | 2.91mg | 5% |
| Selenium | 7.7µg | 10.1µg | 4% |
| Protein | 3.7g | 5.31g | 3% |
| Vitamin D* | 21 IU | 0 IU | 3% |
| Vitamin D | 0.5µg | 0µg | 3% |
| Choline | 22.7mg | 37.3mg | 3% |
| Magnesium | 10mg | 17mg | 2% |
| Potassium | 79mg | 134mg | 2% |
| Copper | 0.068mg | 0.09mg | 2% |
| Zinc | 0.24mg | 0.5mg | 2% |
| Sodium | 515mg | 477mg | 2% |
| Carbs | 50.2g | 47.06g | 1% |
| Vitamin B5 | 0.305mg | 0.377mg | 1% |
| Vitamin B12 | 0.09µg | 0.06µg | 1% |
| Protein per 100 calories | 0.7g | 1.2g | N/A |
| Calories per 10 g protein | 1435kcal | 817kcal | N/A |
| Weight per 100 calories | 19g | 23g | N/A |
| Unsaturated / Saturated Fat ratio | 3.5 | 1.1 | N/A |
| Vitamin C | 0.1mg | 0mg | 0% |
| Net carbs | 50.1g | 45.36g | N/A |
| Calcium | 42mg | 40mg | 0% |
| Sugar | 7.33g | 18.15g | N/A |
| Vitamin B6 | 0.052mg | 0.05mg | 0% |
| Tryptophan | 0.05mg | 0% | |
| Threonine | 0.127mg | 0% | |
| Isoleucine | 0.161mg | 0% | |
| Leucine | 0.274mg | 0% | |
| Lysine | 0.178mg | 0% | |
| Methionine | 0.078mg | 0% | |
| Phenylalanine | 0.178mg | 0% | |
| Valine | 0.184mg | 0% | |
| Histidine | 0.079mg | 0% | |
| Omega-3 - DHA | 0g | 0.001g | N/A |
| Omega-3 - ALA | 0.239g | N/A | |
| Omega-3 - Eicosatrienoic acid | 0.001g | N/A | |
| Omega-6 - Gamma-linoleic acid | 0.017g | N/A | |
| Omega-6 - Eicosadienoic acid | 0.006g | N/A | |
| Omega-6 - Linoleic acid | 3.573g | N/A |
Macronutrient Comparison
Macronutrient breakdown side-by-side comparison
Protein:
3.7 g
Fats:
36.2 g
Carbs:
50.2 g
Water:
8.5 g
Other:
1.4 g
Protein:
5.31 g
Fats:
24.93 g
Carbs:
47.06 g
Water:
20.82 g
Other:
1.88 g
| Contains more FatsFats | +45.2% |
| Contains more ProteinProtein | +43.5% |
| Contains more WaterWater | +144.9% |
| Contains more OtherOther | +34.3% |
~equal in
Carbs
~47.06g
Fat Type Comparison
Fat type breakdown side-by-side comparison
Saturated fat:
Sat. Fat
7.434 g
Monounsaturated fat:
Mono. Fat
15.647 g
Polyunsaturated fat:
Poly. Fat
10.682 g
Saturated fat:
Sat. Fat
11.105 g
Monounsaturated fat:
Mono. Fat
8.544 g
Polyunsaturated fat:
Poly. Fat
3.915 g
| Contains less Sat. FatSaturated fat | -33.1% |
| Contains more Mono. FatMonounsaturated fat | +83.1% |
| Contains more Poly. FatPolyunsaturated fat | +172.8% |