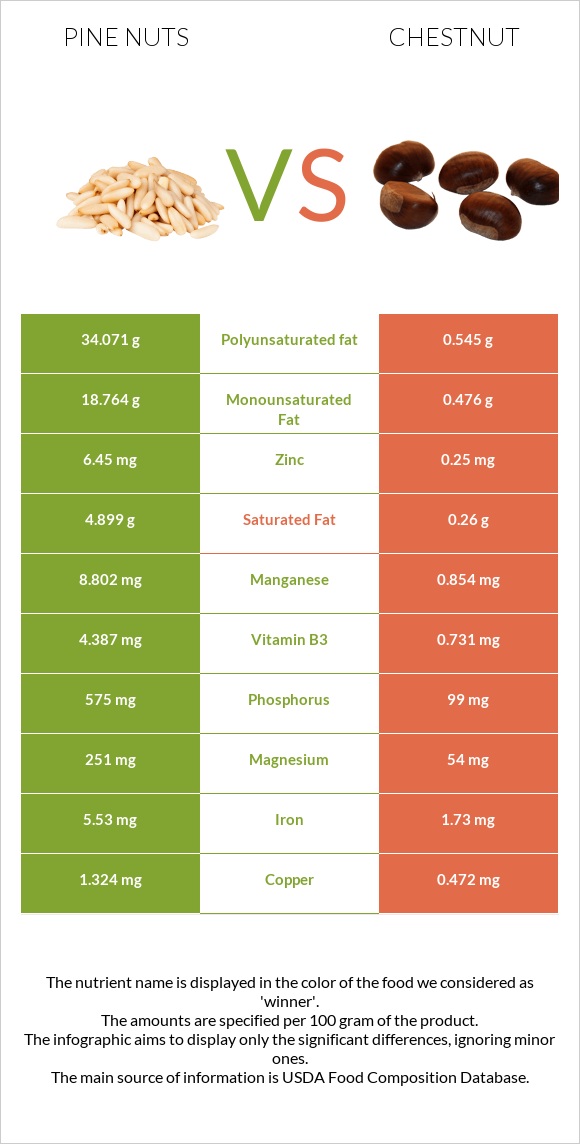
How are pine nuts and chestnut different? Pine nuts are richer in manganese, copper, phosphorus, zinc, iron, magnesium, vitamin B3, and vitamin B1, while chestnut is higher in vitamin C. Pine nuts cover your daily need for manganese, 346% more than chestnut. Pine nuts contain 26 times more zinc than chestnut. Pine nuts contain 6.45mg of zinc, while chestnut contains 0.25mg. Chestnut is lower in saturated fat. Nuts, pine nuts, dried and Nuts, chestnuts, european, boiled, and steamed types were used in this article.
Infographic
Mineral Comparison
Mineral comparison score is based on the number of minerals by which one or the other food is richer. The "coverage" charts below show how much of the daily needs can be covered by 300 grams of the food.
8
100 g
300 g
10 nuts - 1.7g 1 oz (167 kernels) - 28.35g 1 cup - 135g
Magnesium
Magnesium
Calcium
Calcium
Potassium
Potassium
Iron
Iron
Copper
Copper
Zinc
Zinc
Phosphorus
Phosphorus
Sodium
Sodium
Manganese
Manganese
Selenium
Selenium
179%
4.8%
53%
207%
441%
176%
246%
0.26%
1148%
3.8%
2
100 g
300 g
1 oz - 28.35g
Magnesium
Magnesium
Calcium
Calcium
Potassium
Potassium
Iron
Iron
Copper
Copper
Zinc
Zinc
Phosphorus
Phosphorus
Sodium
Sodium
Manganese
Manganese
Selenium
Selenium
39%
14%
63%
65%
157%
6.8%
42%
3.5%
111%
0%
Vitamin Comparison
Vitamin comparison score is based on the number of vitamins by which one or the other food is richer. The "coverage" charts below show how much of the daily needs can be covered by 300 grams of the food.
5
100 g
300 g
10 nuts - 1.7g 1 oz (167 kernels) - 28.35g 1 cup - 135g
Vitamin C
Vit. C
Vitamin D
Vit. D
Vitamin A
Vit. A
Vitamin E
Vit. E
Vitamin B1
Vit. B1
Vitamin B2
Vit. B2
Vitamin B3
Vit. B3
Vitamin B5
Vit. B5
Vitamin B6
Vit. B6
Vitamin B12
Vit. B12
Vitamin K
Vit. K
Folate
Folate
2.7%
0%
0.33%
187%
91%
52%
82%
19%
22%
0%
135%
26%
3
100 g
300 g
1 oz - 28.35g
Vitamin C
Vit. C
Vitamin D
Vit. D
Vitamin A
Vit. A
Vitamin E
Vit. E
Vitamin B1
Vit. B1
Vitamin B2
Vit. B2
Vitamin B3
Vit. B3
Vitamin B5
Vit. B5
Vitamin B6
Vit. B6
Vitamin B12
Vit. B12
Vitamin K
Vit. K
Folate
Folate
89%
0%
0.33%
0%
37%
24%
14%
19%
54%
0%
0%
29%
All nutrients comparison - raw data values
Nutrient
DV% diff.
Manganese
8.802mg
0.854mg
346%
Polyunsaturated fat
34.071g
0.545g
224%
Fats
68.37g
1.38g
103%
Copper
1.324mg
0.472mg
95%
Phosphorus
575mg
99mg
68%
Vitamin E
9.33mg
62%
Zinc
6.45mg
0.25mg
56%
Iron
5.53mg
1.73mg
48%
Magnesium
251mg
54mg
47%
Monounsaturated fat
18.764g
0.476g
46%
Vitamin K
53.9µg
45%
Vitamin C
0.8mg
26.7mg
29%
Calories
673kcal
131kcal
27%
Protein
13.69g
2g
23%
Vitamin B3
4.387mg
0.731mg
23%
Saturated fat
4.899g
0.26g
21%
Vitamin B1
0.364mg
0.148mg
18%
Fiber
3.7g
15%
Vitamin B6
0.094mg
0.233mg
11%
Choline
55.8mg
10%
Vitamin B2
0.227mg
0.104mg
9%
Carbs
13.08g
27.76g
5%
Calcium
16mg
46mg
3%
Potassium
597mg
715mg
3%
Starch
1.43g
1%
Sodium
2mg
27mg
1%
Selenium
0.7µg
1%
Folate
34µg
38µg
1%
Protein per 100 calories
2g
1.5g
N/A
Calories per 10 g protein
492kcal
655kcal
N/A
Weight per 100 calories
15g
76g
N/A
Unsaturated / Saturated Fat ratio
11
3.9
N/A
Net carbs
9.38g
27.76g
N/A
Sugar
3.59g
N/A
Vitamin A
1µg
1µg
0%
Vitamin B5
0.313mg
0.316mg
0%
Tryptophan
0.107mg
0.022mg
0%
Threonine
0.37mg
0.071mg
0%
Isoleucine
0.542mg
0.079mg
0%
Leucine
0.991mg
0.118mg
0%
Lysine
0.54mg
0.118mg
0%
Methionine
0.259mg
0.047mg
0%
Phenylalanine
0.524mg
0.084mg
0%
Valine
0.687mg
0.112mg
0%
Histidine
0.341mg
0.055mg
0%
Fructose
0.07g
0%
Omega-3 - ALA
0.112g
N/A
Omega-6 - Gamma-linoleic acid
0.052g
N/A
Omega-6 - Eicosadienoic acid
0.404g
N/A
Macronutrient Comparison
Macronutrient breakdown side-by-side comparison
3
14%
68%
13%
2%
3%
Protein:
13.69 g
Fats:
68.37 g
Carbs:
13.08 g
Water:
2.28 g
Other:
2.58 g
2
2%
28%
68%
Protein:
2 g
Fats:
1.38 g
Carbs:
27.76 g
Water:
68.15 g
Other:
0.71 g
Contains
more
Protein Protein
+584.5%
Contains
more
Fats Fats
+4854.3%
Contains
more
Other Other
+263.4%
Contains
more
Carbs Carbs
+112.2%
Contains
more
Water Water
+2889%
Fat Type Comparison
Fat type breakdown side-by-side comparison
2
8%
33%
59%
Saturated fat:
Sat. Fat
4.899 g
Monounsaturated fat:
Mono. Fat
18.764 g
Polyunsaturated fat:
Poly. Fat
34.071 g
1
20%
37%
43%
Saturated fat:
Sat. Fat
0.26 g
Monounsaturated fat:
Mono. Fat
0.476 g
Polyunsaturated fat:
Poly. Fat
0.545 g
Contains
more
Mono. Fat Monounsaturated fat
+3842%
Contains
more
Poly. Fat Polyunsaturated fat
+6151.6%
Contains
less
Sat. Fat Saturated fat
-94.7%