Chestnut Nutrition & Calories - Complete data of all nutrients
Introduction
This article focuses on the nutrition of one of the most common and widely used nuts: the chestnut. Here, we discuss the macro- and micronutrient contents of chestnut varieties in detail.
What Are Chestnuts?
The genus Castanea in the family Fagaceae contains eight or nine trees and shrubs known as chestnuts. Chestnuts are a type of nut that grows on trees that belong to the same family as the beech tree. They have green, spiky shells that peel away to reveal the nut inside. The nuts produced by this plant are referred to as "chestnuts."
There are several types of chestnuts, and they can be broadly categorized into two main groups: European chestnuts (Castanea sativa) and Asian chestnuts (Castanea species from Asia). Within these groups, there are different varieties and species.
Nutrition
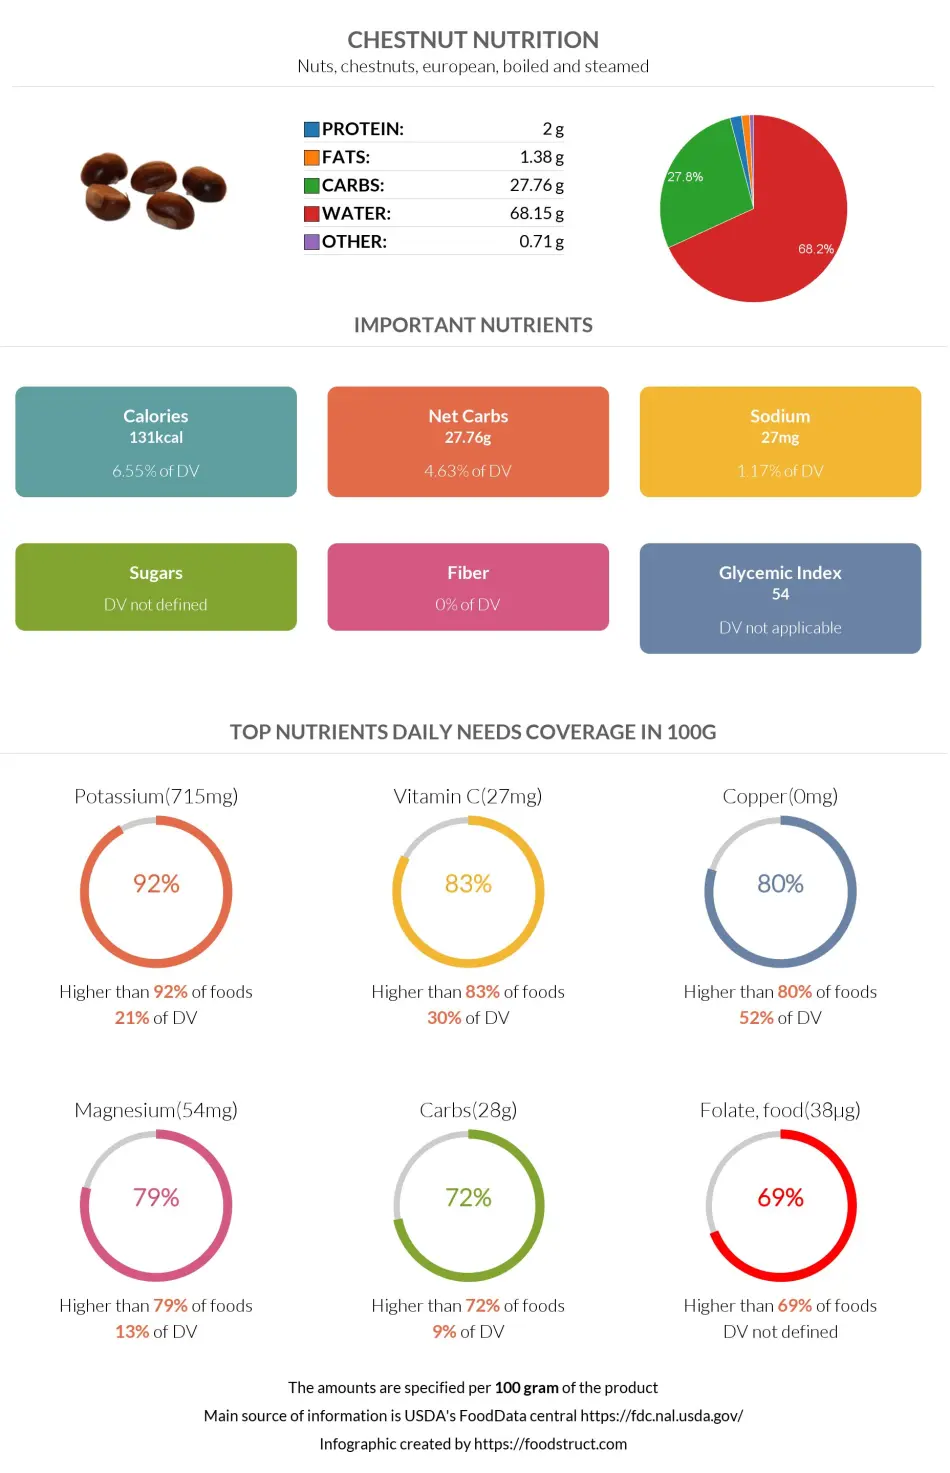
The nutritional infographics below present values for 100g servings of European boiled and steamed chestnuts. We will also discuss the differences in the nutrition of raw, peeled European chestnuts and raw chestnuts (1, 2, 3).
However, one average serving of chestnuts per person is considered 28.35g or 1 ounce.
Boiled chestnuts are dense in nutrients, providing 32% nutrients and 68% water; however, raw chestnuts are nutritionally even denser, with 48% nutrients and 52% water.
Macronutrients chart
Calories
A 100g serving of European boiled and steamed chestnuts provides 131 calories, while the same serving of European raw chestnuts contains 196 and raw Japanese chestnuts 154 calories per 100g.
The serving size (28.35g) of European boiled and steamed chestnut provides 37 calories.
Chestnuts can be considered a medium-calorie food.
Carbohydrates
Chestnuts have a relatively high carbohydrate content. However, these contents can somewhat vary for different types of chestnuts.
With that in mind, European boiled and steamed chestnut provides 27.76 g carbs per 100g, whereas European chestnut has 44g, and Japanese chestnut has 35g total carbs.
Net Carbs and Dietary Fiber
The USDA does not provide information about the dietary fiber content of these European and Japanese chestnuts. However, chestnuts are a good source of this nutrient, providing about 5g per 100g serving on average (4, 5).
Protein
Compared to other nuts, chestnuts have a low amount of protein - only 2g per 100g and 0.5g per average serving size.
Protein plays a role in fueling the brain' and is critical in carrying oxygen through the bloodstream and throughout the body. In low amounts, chestnuts have tryptophan, threonine, isoleucine, phenylalanine, valine, and histidine.
Protein quality breakdown
Fats
Chestnuts have fewer calories than most other nuts because they are low in fat, containing 1.4g per 100g serving.
Of these fats, 0.26g is saturated, 0.48g is monounsaturated, and 0.55g is polyunsaturated (including alpha-linolenic acid).
Chestnuts have no cholesterol or trans fats, which are considered the worst type of fat for your overall health.
The low-fat and high vitamin C content of chestnuts makes them nutritionally more similar to fruits than true nuts.
Fat type information
Vitamins
Chestnuts have a high amount of vitamin C - 26.7 mg per 100g.
The recommended daily amount for vitamin C is 65 to 90mg per day; one hundred grams of chestnuts cover 40% of your daily need. Chestnuts fall in the range of the top 17% of foods as a source of vitamin C.
Chestnuts also have a moderate amount of folate, which is the natural form of vitamin B9.
Other complex B vitamins found in chestnuts include thiamine (vitamin B1) and pyridoxine (vitamin B6). The body requires vitamin B6 to regulate energy within the brain and produce neurotransmitters.
Chestnuts also provide vitamin A and vitamins B2, B3, and B5 in low amounts.
These nuts are absent in vitamin D and vitamin B12.
Vitamin coverage chart
Minerals
Chestnuts are naturally rich in minerals. These nuts have a high amount of copper (0.47mg per 100g), manganese (0.854 mg per 100g), phosphorus (99 mg per 100g), potassium (715 mg per 100g), iron (1.73 mg per 100g), and magnesium (54mg per 100g).
Chestnuts fall in the top 8% of foods as a source of potassium, containing almost 2 times more of it than bananas.
One hundred grams of chestnuts cover 21% of your daily potassium need.
Chestnuts contain a moderate amount of calcium and zinc. They are low in selenium, choline, or sodium.
Mineral coverage chart
Gallic and Ellagic Acids
According to one study, gallic acid and ellagic acid are found in chestnuts and have potent antioxidant properties. These antioxidants protect your cells from free radical damage, which has been linked to various chronic diseases.
Chestnuts may play a role in the treatment of gastric cancer. According to research, gallic acid and ellagic acid affect gastric cancer cells, blocking the growth of these cells (6).
Tannins
Tannins are what give you that astringent, mouth-coating sensation when you bite into an unripe pear or plum. Tannins are also found in chestnuts.
Tannins have antioxidant properties, but there is one disadvantage to consider. It is recommended to avoid eating raw chestnuts due to their high tannin content and potential toxicity. Tannins can make you feel sick, especially if you eat them on an empty stomach. They may also make it difficult for your body to absorb iron from certain foods. This problem is solved by cooking and peeling chestnuts (7).
Carotenoids
Carotenoids are antioxidants that can help you avoid certain diseases and boost your immune system. Carotenoids are phytonutrients that are responsible for the natural color of chestnuts. Carotenoids like lutein and zeaxanthin are abundant in chestnuts. Lutein and zeaxanthin have been linked to a lower risk of cardiovascular disease and some types of cancer and improved visual function (8).
Phenolics
Chestnuts have a high total phenolic content, including free and bound phenolics.
Anthocyanins, flavonoids, proanthocyanidins, flavonols, and isoflavones are among the tidal phenols found in these nuts. These compounds have strong antioxidant properties. Phenolic compounds have been linked to a protective effect against free radical-related diseases like cardiovascular disease and cancer. These nuts may also increase human LDL-cholesterol (LDL-C) resistance (9).
Glycemic Index
Based on the deficient level of carbohydrates, the glycemic index of raw chestnuts is 54. The glycemic index of chestnuts, steamed for 25 min, falls in the range of 58±6.
According to these numbers, chestnuts are considered low glycemic index food (10, 11).
You can also visit our Glycemic index chart page to find glycemic index values of 350+ pages.
Comparison to Similar Foods
We compared chestnuts to other nuts in our database and highlighted which contains more macronutrients.
Chestnuts have more vitamin C and fewer fats compared to walnuts and cashews. Moreover, pecans win hands down in fat, fiber content, and glycemic index value compared to walnuts.
Chestnuts are lower in sugar and calories than hazelnuts.
When it comes to pecans, chestnuts are lower in sugars, saturated fats, and calories.
Chestnuts also win in comparison with almonds. They are lower in sugars, fats, and calories and have more vitamin C.
References
- https://fdc.nal.usda.gov/fdc-app.html#/food-details/170168/nutrients
- https://fdc.nal.usda.gov/fdc-app.html#/food-details/170575/nutrients
- https://fdc.nal.usda.gov/fdc-app.html#/food-details/169413/nutrients
- https://fdc.nal.usda.gov/fdc-app.html#/food-details/1100521/nutrients
- https://fdc.nal.usda.gov/fdc-app.html#/food-details/170190/nutrients
- https://www.ncbi.nlm.nih.gov/pmc/articles/PMC3133749/
- https://bmcvetres.biomedcentral.com/articles/10.1186/s12917-018-1549-2
- https://pubmed.ncbi.nlm.nih.gov/15762089/
- https://pubmed.ncbi.nlm.nih.gov/31906347/
- https://academic.oup.com/ajcn/article/114/5/1625/6320814
- https://www.researchgate.net/publication/264862442

Top nutrition facts for Chestnut
| Calories ⓘ Calories for selected serving | 131 kcal |
|
Glycemic index ⓘ
Source:
Check out our Glycemic index chart page for the full list.
|
54 (low) |
| Glycemic load ⓘ Glycemic Load (GL) is a metric that measures both the quality (Glycemic Index) and quantity of carbohydrates in a specific serving of food to estimate its impact on blood sugar levels. It is calculated as: (GI × Carbs in grams) / 100. | 4 (low) |
| Net carbs ⓘ Net Carbs = Total Carbohydrates – Fiber – Sugar Alcohols | 28 g |
| Default serving size ⓘ Serving sizes are mostly taken from FDA's Reference Amounts Customarily Consumed (RACCs) | 1 oz (28.35 g) |
| Acidity (Based on PRAL) ⓘ PRAL (Potential renal acid load) is calculated using a formula. On the PRAL scale the higher the positive value, the more is the acidifying effect on the body. The lower the negative value, the higher the alkalinity of the food. 0 is neutral. | -12.4 (alkaline) |
| Oxalates | 72 mg ⓘ https://www.sciencedirect.com/science/article/abs/pii/S0889157506001864 |
Chestnut calories (kcal)
| Calories for different serving sizes of chestnut | Calories | Weight |
|---|---|---|
| Calories in 100 grams | 131 | |
| Calories in 1 oz | 37 | 28.35 g |
| Calories for different varieties of chestnut | Calories | Weight |
|---|---|---|
| Nuts, chestnuts, european, boiled and steamed (this food) | 131 | 100 g |
| Nuts, chestnuts, european, raw, peeled | 196 | 100 g |
| Nuts, chestnuts, european, raw, unpeeled | 213 | 100 g |
| Nuts, chestnuts, european, roasted | 245 | 100 g |
| Nuts, chestnuts, european, dried, peeled | 369 | 100 g |
| Nuts, chestnuts, european, dried, unpeeled | 374 | 100 g |
Extra Nutrition facts for Chestnut
| Protein per 100 calories ⓘ Shows how many grams of protein you get from 100 calories of this food, calculated as (protein in g ÷ calories) × 100. | 1.5 g |
| Calories per 10 g protein ⓘ Shows how many calories you need to eat from this food to get 10 g of protein, calculated as (calories ÷ protein in g) × 10. | 655 kcal |
| Weight per 100 calories ⓘ Shows how many grams of this food equal 100 kcal—higher grams mean a larger portion for the same calories. | 76 g |
Chestnut Glycemic index (GI)
Chestnut Glycemic load (GL)
Mineral chart - relative view
Vitamin chart - relative view
All nutrients for Chestnut per 100g
| Nutrient | Value | DV% | In TOP % of foods | Comparison |
| Vitamin A | 1µg | 0% | 55% | |
| Calories | 131kcal | 7% | 65% |
2.8 times more than Orange
|
| Protein | 2g | 5% | 78% |
1.4 times less than Broccoli
|
| Protein per 100 calories | 1.5g | N/A | 78% | |
| Calories per 10 g protein | 655kcal | N/A | 18% | |
| Weight per 100 calories | 76g | N/A | 36% | |
| Fats | 1.4g | 2% | 72% |
24.1 times less than Cheese
|
| Vitamin C | 27mg | 30% | 8% |
2 times less than Lemon
|
| Net carbs | 28g | N/A | 27% |
2 times less than Chocolate
|
| Carbs | 28g | 9% | 29% |
Equal to Rice
|
| Cholesterol | 0mg | 0% | 100% |
N/A
|
| Vitamin D* | 0 IU | 0% | 100% |
N/A
|
| Vitamin D | 0µg | 0% | 100% |
N/A
|
| Magnesium | 54mg | 13% | 13% |
2.6 times less than Almonds
|
| Calcium | 46mg | 5% | 32% |
2.7 times less than Milk
|
| Potassium | 715mg | 21% | 4% |
4.9 times more than Cucumber
|
| Iron | 1.7mg | 22% | 42% |
1.5 times less than Beef broiled
|
| Copper | 0.47mg | 52% | 7% |
3.3 times more than Shiitake
|
| Zinc | 0.25mg | 2% | 74% |
25.2 times less than Beef broiled
|
| Phosphorus | 99mg | 14% | 58% |
1.8 times less than Chicken meat
|
| Sodium | 27mg | 1% | 79% |
18.1 times less than White bread
|
| Manganese | 0.85mg | 37% | 9% | |
| Vitamin B1 | 0.15mg | 12% | 33% |
1.8 times less than Pea raw
|
| Vitamin B2 | 0.1mg | 8% | 61% |
1.3 times less than Avocado
|
| Vitamin B3 | 0.73mg | 5% | 66% |
13.1 times less than Turkey meat
|
| Vitamin B5 | 0.32mg | 6% | 47% |
3.6 times less than Sunflower seeds
|
| Vitamin B6 | 0.23mg | 18% | 36% |
2 times more than Oats
|
| Vitamin B12 | 0µg | 0% | 100% |
N/A
|
| Folate | 38µg | 10% | 25% |
1.6 times less than Brussels sprouts
|
| Saturated fat | 0.26g | 1% | 72% |
22.7 times less than Beef broiled
|
| Monounsaturated fat | 0.48g | N/A | 65% |
20.6 times less than Avocado
|
| Polyunsaturated fat | 0.55g | N/A | 52% |
86.6 times less than Walnut
|
| Tryptophan | 0.02mg | 0% | 50% |
13.9 times less than Chicken meat
|
| Threonine | 0.07mg | 0% | 51% |
10.1 times less than Beef broiled
|
| Isoleucine | 0.08mg | 0% | 51% |
11.6 times less than Salmon raw
|
| Leucine | 0.12mg | 0% | 51% |
20.6 times less than Tuna Bluefin
|
| Lysine | 0.12mg | 0% | 49% |
3.8 times less than Tofu
|
| Methionine | 0.05mg | 0% | 48% |
2 times less than Quinoa
|
| Phenylalanine | 0.08mg | 0% | 51% |
8 times less than Egg
|
| Valine | 0.11mg | 0% | 50% |
18.1 times less than Soybean raw
|
| Histidine | 0.06mg | 0% | 49% |
13.6 times less than Turkey meat
|
Check out similar food or compare with current
NUTRITION FACTS LABEL
Serving Size ______________
Health checks
Chestnut nutrition infographic
References
All the values for which the sources are not specified explicitly are taken from FDA’s Food Central. The exact link to the food presented on this page can be found below.