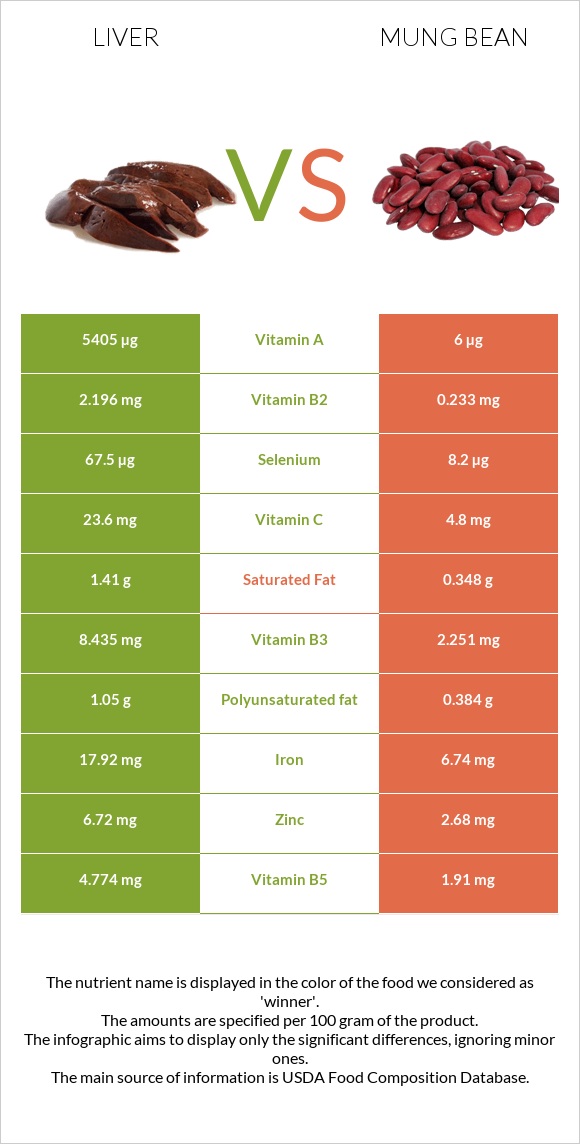
Differences between liver and mung beans Liver is higher in vitamin B12, vitamin A, vitamin B2, iron, selenium, and vitamin B5; however, mung beans are richer in folate, fiber, and magnesium. Liver's daily need coverage for vitamin B12 is 778% higher. Liver has a lower glycemic index (0) than mung beans (31). The food types used in this comparison are Pork, fresh, variety meats, and by-products, liver, cooked, braised and Mung beans, mature seeds, raw .
Infographic
Mineral Comparison
Mineral comparison score is based on the number of minerals by which one or the other food is richer. The "coverage" charts below show how much of the daily needs can be covered by 300 grams of the food.
3
100 g
300 g
3 oz - 85g
Magnesium
Magnesium
Calcium
Calcium
Potassium
Potassium
Iron
Iron
Copper
Copper
Zinc
Zinc
Phosphorus
Phosphorus
Sodium
Sodium
Manganese
Manganese
Selenium
Selenium
10%
3%
13%
672%
211%
183%
103%
6.4%
39%
368%
7
100 g
300 g
1 tbsp - 13g 1 cup - 207g
Magnesium
Magnesium
Calcium
Calcium
Potassium
Potassium
Iron
Iron
Copper
Copper
Zinc
Zinc
Phosphorus
Phosphorus
Sodium
Sodium
Manganese
Manganese
Selenium
Selenium
135%
40%
110%
253%
314%
73%
157%
2%
135%
45%
Vitamin Comparison
Vitamin comparison score is based on the number of vitamins by which one or the other food is richer. The "coverage" charts below show how much of the daily needs can be covered by 300 grams of the food.
7
100 g
300 g
3 oz - 85g
Vitamin C
Vit. C
Vitamin D
Vit. D
Vitamin A
Vit. A
Vitamin E
Vit. E
Vitamin B1
Vit. B1
Vitamin B2
Vit. B2
Vitamin B3
Vit. B3
Vitamin B5
Vit. B5
Vitamin B6
Vit. B6
Vitamin B12
Vit. B12
Vitamin K
Vit. K
Folate
Folate
79%
0%
1802%
0%
65%
507%
158%
286%
132%
2334%
0%
122%
4
100 g
300 g
1 tbsp - 13g 1 cup - 207g
Vitamin C
Vit. C
Vitamin D
Vit. D
Vitamin A
Vit. A
Vitamin E
Vit. E
Vitamin B1
Vit. B1
Vitamin B2
Vit. B2
Vitamin B3
Vit. B3
Vitamin B5
Vit. B5
Vitamin B6
Vit. B6
Vitamin B12
Vit. B12
Vitamin K
Vit. K
Folate
Folate
16%
0%
2%
10%
155%
54%
42%
115%
88%
0%
23%
469%
All nutrients comparison - raw data values
Nutrient
DV% diff.
Vitamin B12
18.67µg
0µg
778%
Vitamin A
5405µg
6µg
600%
Vitamin B2
2.196mg
0.233mg
151%
Iron
17.92mg
6.74mg
140%
Cholesterol
355mg
0mg
118%
Folate
163µg
625µg
116%
Selenium
67.5µg
8.2µg
108%
Fiber
0g
16.3g
65%
Vitamin B5
4.774mg
1.91mg
57%
Magnesium
14mg
189mg
42%
Vitamin B3
8.435mg
2.251mg
39%
Zinc
6.72mg
2.68mg
37%
Copper
0.634mg
0.941mg
34%
Potassium
150mg
1246mg
32%
Manganese
0.3mg
1.035mg
32%
Vitamin B1
0.258mg
0.621mg
30%
Vitamin C
23.6mg
4.8mg
21%
Carbs
3.76g
62.62g
20%
Phosphorus
241mg
367mg
18%
Choline
97.9mg
18%
Vitamin B6
0.57mg
0.382mg
14%
Calcium
10mg
132mg
12%
Calories
165kcal
347kcal
9%
Vitamin K
9µg
8%
Fats
4.4g
1.15g
5%
Saturated fat
1.41g
0.348g
5%
Protein
26.02g
23.86g
4%
Polyunsaturated fat
1.05g
0.384g
4%
Vitamin E
0.51mg
3%
Sodium
49mg
15mg
1%
Monounsaturated fat
0.63g
0.161g
1%
Protein per 100 calories
16g
6.9g
N/A
Calories per 10 g protein
63kcal
145kcal
N/A
Weight per 100 calories
61g
29g
N/A
Unsaturated / Saturated Fat ratio
1.2
1.6
N/A
Net carbs
3.76g
46.32g
N/A
Sugar
6.6g
N/A
Tryptophan
0.366mg
0.26mg
0%
Threonine
1.107mg
0.782mg
0%
Isoleucine
1.32mg
1.008mg
0%
Leucine
2.319mg
1.847mg
0%
Lysine
2.007mg
1.664mg
0%
Methionine
0.645mg
0.286mg
0%
Phenylalanine
1.274mg
1.443mg
0%
Valine
1.607mg
1.237mg
0%
Histidine
0.708mg
0.695mg
0%
Omega-3 - DHA
0.03g
0g
N/A
Omega-3 - DPA
0.04g
0g
N/A
Macronutrient Comparison
Macronutrient breakdown side-by-side comparison
3
26%
4%
4%
64%
Protein:
26.02 g
Fats:
4.4 g
Carbs:
3.76 g
Water:
64.32 g
Other:
1.5 g
2
24%
63%
9%
3%
Protein:
23.86 g
Fats:
1.15 g
Carbs:
62.62 g
Water:
9.05 g
Other:
3.32 g
Contains
more
Fats Fats
+282.6%
Contains
more
Water Water
+610.7%
Contains
more
Carbs Carbs
+1565.4%
Contains
more
Other Other
+121.3%
~equal in
Protein
~23.86g
Fat Type Comparison
Fat type breakdown side-by-side comparison
2
46%
20%
34%
Saturated fat:
Sat. Fat
1.41 g
Monounsaturated fat:
Mono. Fat
0.63 g
Polyunsaturated fat:
Poly. Fat
1.05 g
1
39%
18%
43%
Saturated fat:
Sat. Fat
0.348 g
Monounsaturated fat:
Mono. Fat
0.161 g
Polyunsaturated fat:
Poly. Fat
0.384 g
Contains
more
Mono. Fat Monounsaturated fat
+291.3%
Contains
more
Poly. Fat Polyunsaturated fat
+173.4%
Contains
less
Sat. Fat Saturated fat
-75.3%