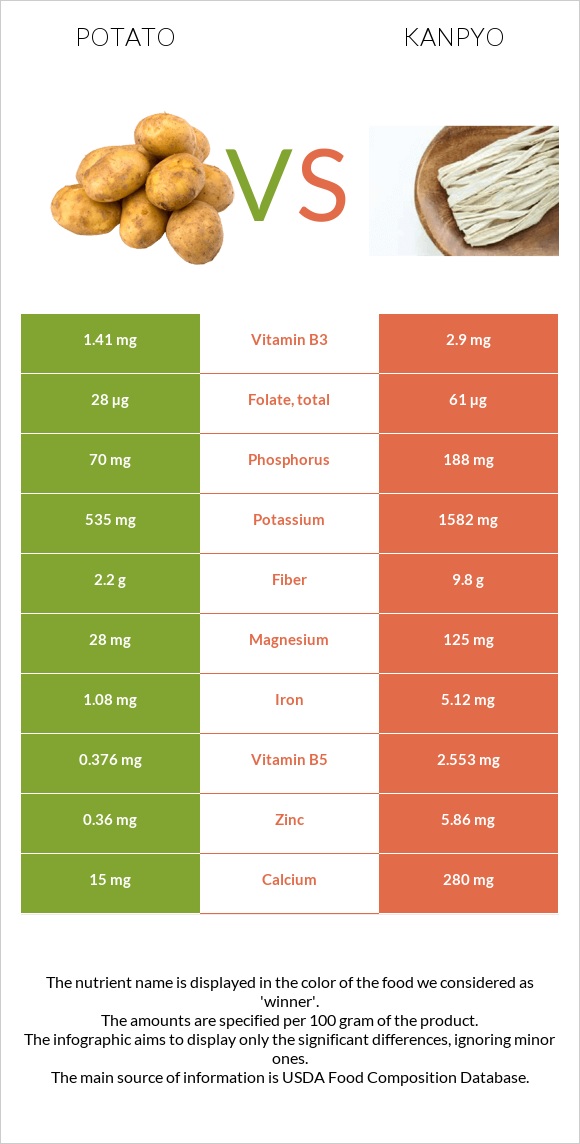
Differences between potatoes and kanpyo Potatoes contain less iron, zinc, vitamin B5, manganese, copper, potassium, fiber, calcium, magnesium, and vitamin B6 than kanpyo. Kanpyo's daily need coverage for iron is 51% higher. The food types used in this comparison are Potatoes, baked, flesh, and skin, without salt and Kanpyo, (dried gourd strips) .
Infographic
Mineral Comparison
Mineral comparison score is based on the number of minerals by which one or the other food is richer. The "coverage" charts below show how much of the daily needs can be covered by 300 grams of the food.
1
100 g
300 g
1 potato small - 138g 1 NLEA serving - 148g 1 potato medium - 173g 1 potato large - 299g
Magnesium
Magnesium
Calcium
Calcium
Potassium
Potassium
Iron
Iron
Copper
Copper
Zinc
Zinc
Phosphorus
Phosphorus
Sodium
Sodium
Manganese
Manganese
Selenium
Selenium
20%
4.5%
47%
41%
39%
9.8%
30%
1.3%
29%
2.2%
9
100 g
300 g
1 strip - 6.3g 0.5 cup - 27g
Magnesium
Magnesium
Calcium
Calcium
Potassium
Potassium
Iron
Iron
Copper
Copper
Zinc
Zinc
Phosphorus
Phosphorus
Sodium
Sodium
Manganese
Manganese
Selenium
Selenium
89%
84%
140%
192%
144%
160%
81%
2%
148%
14%
Vitamin Comparison
Vitamin comparison score is based on the number of vitamins by which one or the other food is richer. The "coverage" charts below show how much of the daily needs can be covered by 300 grams of the food.
5
100 g
300 g
1 potato small - 138g 1 NLEA serving - 148g 1 potato medium - 173g 1 potato large - 299g
Vitamin C
Vit. C
Vitamin D
Vit. D
Vitamin A
Vit. A
Vitamin E
Vit. E
Vitamin B1
Vit. B1
Vitamin B2
Vit. B2
Vitamin B3
Vit. B3
Vitamin B5
Vit. B5
Vitamin B6
Vit. B6
Vitamin B12
Vit. B12
Vitamin K
Vit. K
Folate
Folate
32%
0%
0.33%
0.8%
16%
11%
26%
23%
72%
0%
5%
21%
4
100 g
300 g
1 strip - 6.3g 0.5 cup - 27g
Vitamin C
Vit. C
Vitamin D
Vit. D
Vitamin A
Vit. A
Vitamin E
Vit. E
Vitamin B1
Vit. B1
Vitamin B2
Vit. B2
Vitamin B3
Vit. B3
Vitamin B5
Vit. B5
Vitamin B6
Vit. B6
Vitamin B12
Vit. B12
Vitamin K
Vit. K
Folate
Folate
0.67%
0%
0%
0%
0%
10%
54%
153%
123%
0%
0%
46%
All nutrients comparison - raw data values
Nutrient
DV% diff.
Iron
1.08mg
5.12mg
51%
Zinc
0.36mg
5.86mg
50%
Vitamin B5
0.376mg
2.553mg
44%
Manganese
0.219mg
1.137mg
40%
Copper
0.118mg
0.433mg
35%
Potassium
535mg
1582mg
31%
Fiber
2.2g
9.8g
30%
Calcium
15mg
280mg
27%
Magnesium
28mg
125mg
23%
Phosphorus
70mg
188mg
17%
Vitamin B6
0.311mg
0.532mg
17%
Carbs
21.15g
65.03g
15%
Protein
2.5g
8.58g
12%
Vitamin C
9.6mg
0.2mg
10%
Vitamin B3
1.41mg
2.9mg
9%
Calories
93kcal
258kcal
8%
Folate
28µg
61µg
8%
Starch
17.27g
7%
Vitamin B1
0.064mg
0mg
5%
Selenium
0.4µg
2.6µg
4%
Choline
14.8mg
3%
Vitamin K
2µg
2%
Fats
0.13g
0.56g
1%
Polyunsaturated fat
0.057g
0.244g
1%
Protein per 100 calories
2.7g
3.3g
N/A
Calories per 10 g protein
372kcal
301kcal
N/A
Weight per 100 calories
108g
39g
N/A
Net carbs
18.95g
55.23g
N/A
Sugar
1.18g
N/A
Sodium
10mg
15mg
0%
Vitamin A
1µg
0%
Vitamin E
0.04mg
0%
Vitamin B2
0.048mg
0.044mg
0%
Saturated fat
0.034g
0.045g
0%
Monounsaturated fat
0.003g
0.103g
0%
Tryptophan
0.025mg
0%
Threonine
0.081mg
0%
Isoleucine
0.08mg
0%
Leucine
0.119mg
0%
Lysine
0.13mg
0%
Methionine
0.038mg
0%
Phenylalanine
0.099mg
0%
Valine
0.125mg
0%
Histidine
0.042mg
0%
Fructose
0.34g
0%
Macronutrient Comparison
Macronutrient breakdown side-by-side comparison
1
3%
21%
75%
Protein:
2.5 g
Fats:
0.13 g
Carbs:
21.15 g
Water:
74.89 g
Other:
1.33 g
4
9%
65%
20%
6%
Protein:
8.58 g
Fats:
0.56 g
Carbs:
65.03 g
Water:
19.97 g
Other:
5.86 g
Contains
more
Water Water
+275%
Contains
more
Protein Protein
+243.2%
Contains
more
Fats Fats
+330.8%
Contains
more
Carbs Carbs
+207.5%
Contains
more
Other Other
+340.6%
Fat Type Comparison
Fat type breakdown side-by-side comparison
1
36%
3%
61%
Saturated fat:
Sat. Fat
0.034 g
Monounsaturated fat:
Mono. Fat
0.003 g
Polyunsaturated fat:
Poly. Fat
0.057 g
2
11%
26%
62%
Saturated fat:
Sat. Fat
0.045 g
Monounsaturated fat:
Mono. Fat
0.103 g
Polyunsaturated fat:
Poly. Fat
0.244 g
Contains
less
Sat. Fat Saturated fat
-24.4%
Contains
more
Mono. Fat Monounsaturated fat
+3333.3%
Contains
more
Poly. Fat Polyunsaturated fat
+328.1%