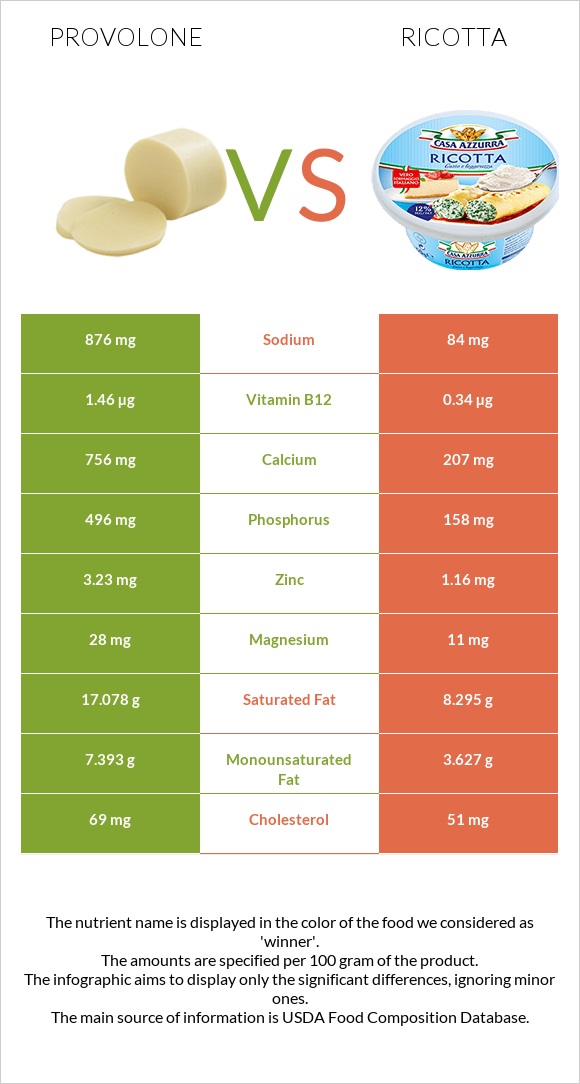
Differences between provolone and ricotta Ricotta contains less calcium, phosphorus, vitamin B12, zinc, vitamin B2, vitamin A, and vitamin B5 than provolone. Provolone's daily need coverage for calcium is 55% higher. Ricotta contains 10 times less sodium than provolone. Provolone contains 876mg of sodium, while ricotta contains 84mg. The food types used in this comparison are Cheese, provolone and Cheese, ricotta, whole milk .
Infographic
Mineral Comparison
Mineral comparison score is based on the number of minerals by which one or the other food is richer. The "coverage" charts below show how much of the daily needs can be covered by 300 grams of the food.
8
100 g
300 g
1 cubic inch - 17g 1 slice (1 oz) - 28g 1 oz - 28.35g 1 cup, diced - 132g 1 package (6 oz) - 170g
Magnesium
Magnesium
Calcium
Calcium
Potassium
Potassium
Iron
Iron
Copper
Copper
Zinc
Zinc
Phosphorus
Phosphorus
Sodium
Sodium
Manganese
Manganese
Selenium
Selenium
20%
227%
12%
20%
8.7%
88%
213%
114%
1.3%
79%
1
100 g
300 g
1 small cup - 55g 0.5 cup - 124g 1 cup - 246g
Magnesium
Magnesium
Calcium
Calcium
Potassium
Potassium
Iron
Iron
Copper
Copper
Zinc
Zinc
Phosphorus
Phosphorus
Sodium
Sodium
Manganese
Manganese
Selenium
Selenium
7.9%
62%
9.3%
14%
7%
32%
68%
11%
0.78%
79%
Vitamin Comparison
Vitamin comparison score is based on the number of vitamins by which one or the other food is richer. The "coverage" charts below show how much of the daily needs can be covered by 300 grams of the food.
10
100 g
300 g
1 cubic inch - 17g 1 slice (1 oz) - 28g 1 oz - 28.35g 1 cup, diced - 132g 1 package (6 oz) - 170g
Vitamin C
Vit. C
Vitamin D
Vit. D
Vitamin A
Vit. A
Vitamin E
Vit. E
Vitamin B1
Vit. B1
Vitamin B2
Vit. B2
Vitamin B3
Vit. B3
Vitamin B5
Vit. B5
Vitamin B6
Vit. B6
Vitamin B12
Vit. B12
Vitamin K
Vit. K
Folate
Folate
0%
7.5%
79%
4.6%
4.8%
74%
2.9%
29%
17%
183%
5.5%
7.5%
1
100 g
300 g
1 small cup - 55g 0.5 cup - 124g 1 cup - 246g
Vitamin C
Vit. C
Vitamin D
Vit. D
Vitamin A
Vit. A
Vitamin E
Vit. E
Vitamin B1
Vit. B1
Vitamin B2
Vit. B2
Vitamin B3
Vit. B3
Vitamin B5
Vit. B5
Vitamin B6
Vit. B6
Vitamin B12
Vit. B12
Vitamin K
Vit. K
Folate
Folate
0%
3%
40%
2.2%
3.3%
45%
2%
13%
9.9%
43%
2.8%
9%
All nutrients comparison - raw data values
Nutrient
DV% diff.
Calcium
756mg
207mg
55%
Phosphorus
496mg
158mg
48%
Vitamin B12
1.46µg
0.34µg
47%
Saturated fat
17.078g
8.295g
40%
Sodium
876mg
84mg
34%
Protein
25.58g
11.26g
29%
Fats
26.62g
12.98g
21%
Zinc
3.23mg
1.16mg
19%
Vitamin A
236µg
120µg
13%
Vitamin B2
0.321mg
0.195mg
10%
Calories
351kcal
174kcal
9%
Monounsaturated fat
7.393g
3.627g
9%
Cholesterol
69mg
51mg
6%
Vitamin B5
0.476mg
0.213mg
5%
Magnesium
28mg
11mg
4%
Polyunsaturated fat
0.769g
0.385g
3%
Vitamin D
0.5µg
0.2µg
2%
Iron
0.52mg
0.38mg
2%
Vitamin B6
0.073mg
0.043mg
2%
Vitamin D*
20 IU
10 IU
1%
Potassium
138mg
105mg
1%
Copper
0.026mg
0.021mg
1%
Vitamin E
0.23mg
0.11mg
1%
Vitamin B1
0.019mg
0.013mg
1%
Vitamin K
2.2µg
1.1µg
1%
Folate
10µg
12µg
1%
Protein per 100 calories
7.3g
6.5g
N/A
Calories per 10 g protein
137kcal
155kcal
N/A
Weight per 100 calories
28g
57g
N/A
Unsaturated / Saturated Fat ratio
0.48
0.48
N/A
Net carbs
2.14g
3.04g
N/A
Carbs
2.14g
3.04g
0%
Sugar
0.56g
0.27g
N/A
Manganese
0.01mg
0.006mg
0%
Selenium
14.5µg
14.5µg
0%
Vitamin B3
0.156mg
0.104mg
0%
Choline
15.4mg
17.5mg
0%
Tryptophan
0.345mg
0.125mg
0%
Threonine
0.982mg
0.517mg
0%
Isoleucine
1.091mg
0.589mg
0%
Leucine
2.297mg
1.221mg
0%
Lysine
2.646mg
1.338mg
0%
Methionine
0.686mg
0.281mg
0%
Phenylalanine
1.287mg
0.556mg
0%
Valine
1.64mg
0.692mg
0%
Histidine
1.115mg
0.459mg
0%
Macronutrient Comparison
Macronutrient breakdown side-by-side comparison
3
26%
27%
2%
41%
5%
Protein:
25.58 g
Fats:
26.62 g
Carbs:
2.14 g
Water:
40.95 g
Other:
4.71 g
2
11%
13%
3%
72%
Protein:
11.26 g
Fats:
12.98 g
Carbs:
3.04 g
Water:
71.7 g
Other:
1.02 g
Contains
more
Protein Protein
+127.2%
Contains
more
Fats Fats
+105.1%
Contains
more
Other Other
+361.8%
Contains
more
Carbs Carbs
+42.1%
Contains
more
Water Water
+75.1%
Fat Type Comparison
Fat type breakdown side-by-side comparison
2
68%
29%
3%
Saturated fat:
Sat. Fat
17.078 g
Monounsaturated fat:
Mono. Fat
7.393 g
Polyunsaturated fat:
Poly. Fat
0.769 g
1
67%
29%
3%
Saturated fat:
Sat. Fat
8.295 g
Monounsaturated fat:
Mono. Fat
3.627 g
Polyunsaturated fat:
Poly. Fat
0.385 g
Contains
more
Mono. Fat Monounsaturated fat
+103.8%
Contains
more
Poly. Fat Polyunsaturated fat
+99.7%
Contains
less
Sat. Fat Saturated fat
-51.4%