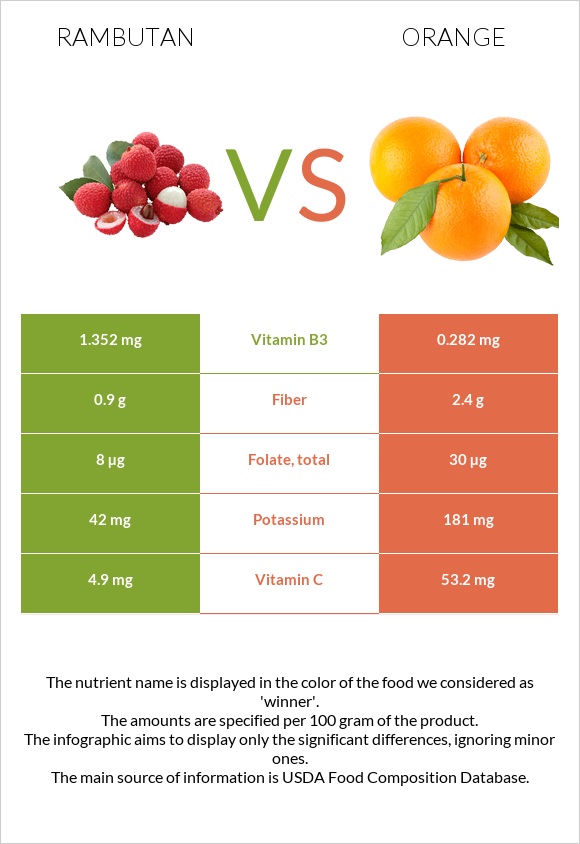
Differences between rambutan and oranges Rambutan is higher in manganese and vitamin B3; however, oranges are richer in vitamin C, vitamin B1, fiber, and folate. Oranges' daily need coverage for vitamin C is 54% higher. Rambutan has 14 times more manganese than oranges. While rambutan has 0.343mg of manganese, oranges have only 0.025mg. Oranges have a lower glycemic index (45) than rambutan (59). The food types used in this comparison are Rambutan, canned, syrup pack and Oranges, raw, all commercial varieties .
Infographic
Mineral Comparison
Mineral comparison score is based on the number of minerals by which one or the other food is richer. The "coverage" charts below show how much of the daily needs can be covered by 300 grams of the food.
4
100 g
300 g
1 fruit - 9g 1 cup, drained - 150g 1 cup - 214g
Magnesium
Magnesium
Calcium
Calcium
Potassium
Potassium
Iron
Iron
Copper
Copper
Zinc
Zinc
Phosphorus
Phosphorus
Sodium
Sodium
Manganese
Manganese
Selenium
Selenium
5%
6.6%
3.7%
13%
22%
2.2%
3.9%
1.4%
45%
0%
6
100 g
300 g
1 small (2-3/8" dia) - 96g 1 fruit (2-5/8" dia) - 131g 1 cup, sections - 180g 1 large (3-1/16" dia) - 184g
Magnesium
Magnesium
Calcium
Calcium
Potassium
Potassium
Iron
Iron
Copper
Copper
Zinc
Zinc
Phosphorus
Phosphorus
Sodium
Sodium
Manganese
Manganese
Selenium
Selenium
7.1%
12%
16%
3.8%
15%
1.9%
6%
0%
3.3%
2.7%
Vitamin Comparison
Vitamin comparison score is based on the number of vitamins by which one or the other food is richer. The "coverage" charts below show how much of the daily needs can be covered by 300 grams of the food.
1
100 g
300 g
1 fruit - 9g 1 cup, drained - 150g 1 cup - 214g
Vitamin C
Vit. C
Vitamin D
Vit. D
Vitamin A
Vit. A
Vitamin E
Vit. E
Vitamin B1
Vit. B1
Vitamin B2
Vit. B2
Vitamin B3
Vit. B3
Vitamin B5
Vit. B5
Vitamin B6
Vit. B6
Vitamin B12
Vit. B12
Vitamin K
Vit. K
Folate
Folate
16%
0%
0%
0%
3.3%
5.1%
25%
1.1%
4.6%
0%
0%
6%
8
100 g
300 g
1 small (2-3/8" dia) - 96g 1 fruit (2-5/8" dia) - 131g 1 cup, sections - 180g 1 large (3-1/16" dia) - 184g
Vitamin C
Vit. C
Vitamin D
Vit. D
Vitamin A
Vit. A
Vitamin E
Vit. E
Vitamin B1
Vit. B1
Vitamin B2
Vit. B2
Vitamin B3
Vit. B3
Vitamin B5
Vit. B5
Vitamin B6
Vit. B6
Vitamin B12
Vit. B12
Vitamin K
Vit. K
Folate
Folate
177%
0%
3.7%
3.6%
22%
9.2%
5.3%
15%
14%
0%
0%
23%
All nutrients comparison - raw data values
Nutrient
DV% diff.
Vitamin C
4.9mg
53.2mg
54%
Manganese
0.343mg
0.025mg
14%
Vitamin B3
1.352mg
0.282mg
7%
Fiber
0.9g
2.4g
6%
Vitamin B1
0.013mg
0.087mg
6%
Folate
8µg
30µg
6%
Vitamin B5
0.018mg
0.25mg
5%
Potassium
42mg
181mg
4%
Carbs
20.87g
11.75g
3%
Iron
0.35mg
0.1mg
3%
Vitamin B6
0.02mg
0.06mg
3%
Calories
82kcal
47kcal
2%
Calcium
22mg
40mg
2%
Copper
0.066mg
0.045mg
2%
Choline
8.4mg
2%
Protein
0.65g
0.94g
1%
Magnesium
7mg
10mg
1%
Phosphorus
9mg
14mg
1%
Vitamin A
0µg
11µg
1%
Vitamin E
0.18mg
1%
Selenium
0.5µg
1%
Vitamin B2
0.022mg
0.04mg
1%
Protein per 100 calories
0.79g
2g
N/A
Calories per 10 g protein
1262kcal
500kcal
N/A
Weight per 100 calories
122g
213g
N/A
Fats
0.21g
0.12g
0%
Net carbs
19.97g
9.35g
N/A
Sugar
9.35g
N/A
Zinc
0.08mg
0.07mg
0%
Sodium
11mg
0mg
0%
Saturated fat
0.015g
0%
Monounsaturated fat
0.023g
0%
Polyunsaturated fat
0.025g
0%
Tryptophan
0.009mg
0%
Threonine
0.015mg
0%
Isoleucine
0.025mg
0%
Leucine
0.023mg
0%
Lysine
0.047mg
0%
Methionine
0.02mg
0%
Phenylalanine
0.031mg
0%
Valine
0.04mg
0%
Histidine
0.018mg
0%
Macronutrient Comparison
Macronutrient breakdown side-by-side comparison
2
21%
78%
Protein:
0.65 g
Fats:
0.21 g
Carbs:
20.87 g
Water:
78.04 g
Other:
0.23 g
3
12%
87%
Protein:
0.94 g
Fats:
0.12 g
Carbs:
11.75 g
Water:
86.75 g
Other:
0.44 g
Contains
more
Fats Fats
+75%
Contains
more
Carbs Carbs
+77.6%
Contains
more
Protein Protein
+44.6%
Contains
more
Water Water
+11.2%
Contains
more
Other Other
+91.3%