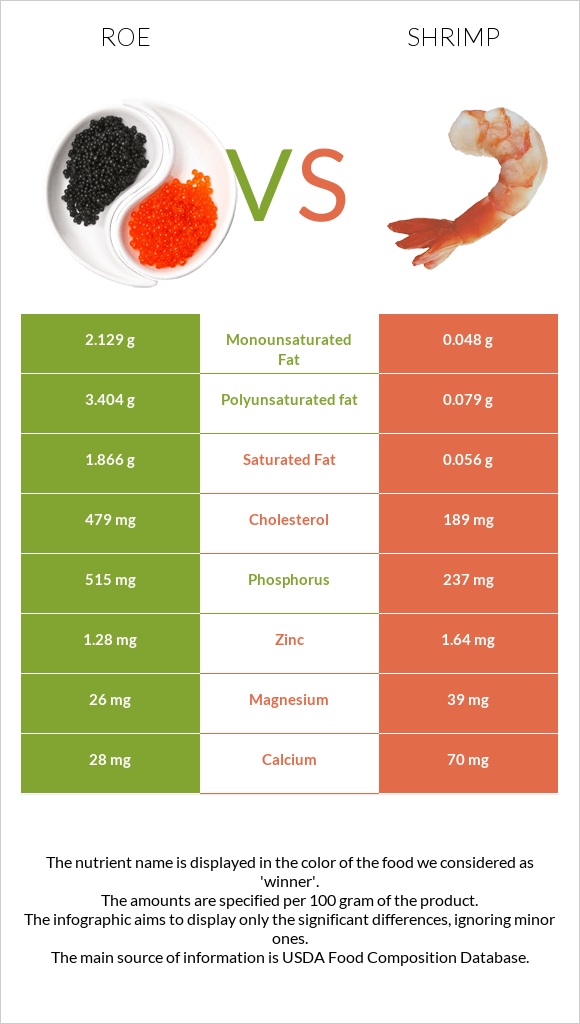
How are roe and shrimp different? Roe is richer in phosphorus, monounsaturated fat, and polyunsaturated fat, while shrimp is higher in copper. Roe covers your daily need for cholesterol, 97% more than shrimp. Roe contains 44 times more monounsaturated fat than shrimp. Roe contains 2.129g of monounsaturated fat, while shrimp contains 0.048g. Shrimp is lower in saturated fat. Shrimp has a higher glycemic index (50) than roe (27). Fish, roe, mixed species, cooked, dry heat and Crustaceans, shrimp, cooked (not previously frozen) types were used in this article.
Infographic
Mineral Comparison
Mineral comparison score is based on the number of minerals by which one or the other food is richer. The "coverage" charts below show how much of the daily needs can be covered by 300 grams of the food.
3
100 g
300 g
1 oz - 28.35g 3 oz - 85g
Magnesium
Magnesium
Calcium
Calcium
Potassium
Potassium
Iron
Iron
Copper
Copper
Zinc
Zinc
Phosphorus
Phosphorus
Sodium
Sodium
Manganese
Manganese
Selenium
Selenium
19%
8.4%
25%
29%
43%
35%
221%
15%
1.7%
282%
5
100 g
300 g
3 oz - 85g
Magnesium
Magnesium
Calcium
Calcium
Potassium
Potassium
Iron
Iron
Copper
Copper
Zinc
Zinc
Phosphorus
Phosphorus
Sodium
Sodium
Manganese
Manganese
Selenium
Selenium
28%
21%
23%
19%
126%
45%
102%
14%
4.3%
0%
Vitamin Comparison
Vitamin comparison score is based on the number of vitamins by which one or the other food is richer. The "coverage" charts below show how much of the daily needs can be covered by 300 grams of the food.
9
100 g
300 g
1 oz - 28.35g 3 oz - 85g
Vitamin C
Vit. C
Vitamin D
Vit. D
Vitamin A
Vit. A
Vitamin E
Vit. E
Vitamin B1
Vit. B1
Vitamin B2
Vit. B2
Vitamin B3
Vit. B3
Vitamin B5
Vit. B5
Vitamin B6
Vit. B6
Vitamin B12
Vit. B12
Vitamin K
Vit. K
Folate
Folate
55%
0%
30%
0%
69%
219%
41%
69%
43%
1443%
0%
69%
0
100 g
300 g
3 oz - 85g
Vitamin C
Vit. C
Vitamin D
Vit. D
Vitamin A
Vit. A
Vitamin E
Vit. E
Vitamin B1
Vit. B1
Vitamin B2
Vit. B2
Vitamin B3
Vit. B3
Vitamin B5
Vit. B5
Vitamin B6
Vit. B6
Vitamin B12
Vit. B12
Vitamin K
Vit. K
Folate
Folate
0%
0%
0%
0%
0%
0%
0%
0%
0%
0%
0%
0%
All nutrients comparison - raw data values
Nutrient
DV% diff.
Vitamin B12
11.54µg
481%
Cholesterol
479mg
189mg
97%
Selenium
51.7µg
94%
Vitamin B2
0.949mg
73%
Phosphorus
515mg
237mg
40%
Copper
0.128mg
0.379mg
28%
Vitamin B1
0.277mg
23%
Vitamin B5
1.154mg
23%
Folate
92µg
23%
Polyunsaturated fat
3.404g
0.079g
22%
Vitamin C
16.4mg
18%
Vitamin B3
2.192mg
14%
Vitamin B6
0.185mg
14%
Fats
8.23g
0.28g
12%
Vitamin A
91µg
10%
Protein
28.62g
23.98g
9%
Saturated fat
1.866g
0.056g
8%
Calories
204kcal
99kcal
5%
Monounsaturated fat
2.129g
0.048g
5%
Calcium
28mg
70mg
4%
Magnesium
26mg
39mg
3%
Iron
0.77mg
0.51mg
3%
Zinc
1.28mg
1.64mg
3%
Carbs
1.92g
0.2g
1%
Potassium
283mg
259mg
1%
Manganese
0.013mg
0.033mg
1%
Protein per 100 calories
14g
24g
N/A
Calories per 10 g protein
71kcal
41kcal
N/A
Weight per 100 calories
49g
101g
N/A
Unsaturated / Saturated Fat ratio
3
2.3
N/A
Net carbs
1.92g
0.2g
N/A
Sodium
117mg
111mg
0%
Trans fat
0.002g
N/A
Tryptophan
0.375mg
0%
Threonine
1.305mg
0%
Isoleucine
1.465mg
0%
Leucine
2.509mg
0%
Lysine
2.179mg
0%
Methionine
0.71mg
0%
Phenylalanine
1.401mg
0%
Valine
1.676mg
0%
Histidine
0.778mg
0%
Omega-3 - EPA
1.26g
0.015g
N/A
Omega-3 - DHA
1.747g
0.015g
N/A
Omega-3 - ALA
0.001g
N/A
Omega-3 - DPA
0.105g
0.001g
N/A
Omega-6 - Dihomo-gamma-linoleic acid
0.001g
N/A
Omega-6 - Eicosadienoic acid
0.002g
N/A
Omega-6 - Linoleic acid
0.018g
N/A
Macronutrient Comparison
Macronutrient breakdown side-by-side comparison
4
29%
8%
2%
59%
3%
Protein:
28.62 g
Fats:
8.23 g
Carbs:
1.92 g
Water:
58.63 g
Other:
2.6 g
1
24%
74%
Protein:
23.98 g
Fats:
0.28 g
Carbs:
0.2 g
Water:
74.33 g
Other:
1.21 g
Contains
more
Protein Protein
+19.3%
Contains
more
Fats Fats
+2839.3%
Contains
more
Carbs Carbs
+860%
Contains
more
Other Other
+114.9%
Contains
more
Water Water
+26.8%
Fat Type Comparison
Fat type breakdown side-by-side comparison
2
25%
29%
46%
Saturated fat:
Sat. Fat
1.866 g
Monounsaturated fat:
Mono. Fat
2.129 g
Polyunsaturated fat:
Poly. Fat
3.404 g
1
31%
26%
43%
Saturated fat:
Sat. Fat
0.056 g
Monounsaturated fat:
Mono. Fat
0.048 g
Polyunsaturated fat:
Poly. Fat
0.079 g
Contains
more
Mono. Fat Monounsaturated fat
+4335.4%
Contains
more
Poly. Fat Polyunsaturated fat
+4208.9%
Contains
less
Sat. Fat Saturated fat
-97%