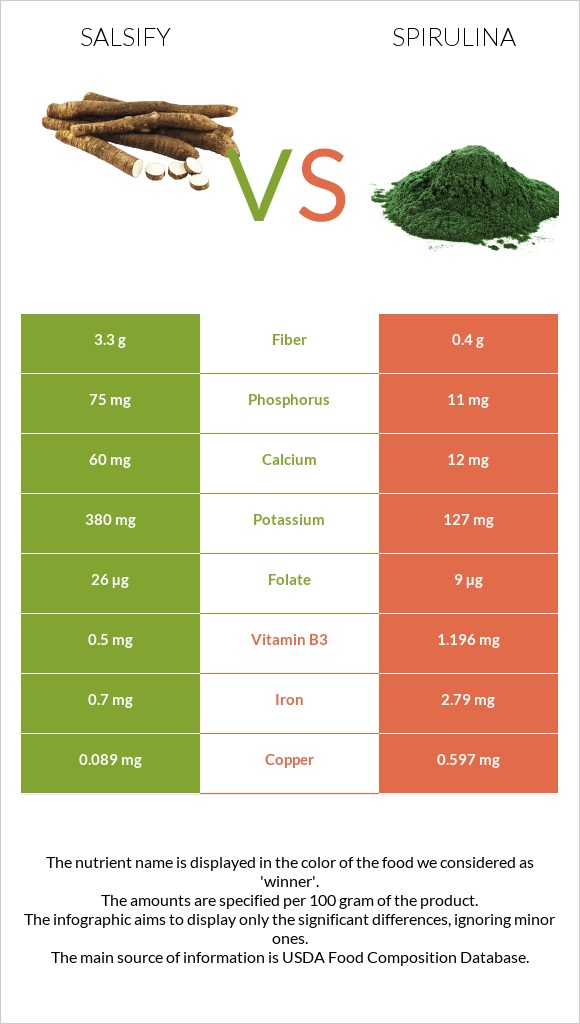
The main differences between salsify and spirulina Salsify is richer in vitamin B6, fiber, and phosphorus, yet spirulina is richer in copper, iron, vitamin B1, vitamin B2, and vitamin B3. Daily need coverage for copper for spirulina is 59% higher. Salsify contains 8 times more fiber than spirulina. Salsify contains 3.1g of fiber, while spirulina contains 0.4g. Food types used in this article are Salsify, cooked, boiled, drained, without salt and Seaweed, spirulina, raw .
Infographic
Mineral Comparison
Mineral comparison score is based on the number of minerals by which one or the other food is richer. The "coverage" charts below show how much of the daily needs can be covered by 300 grams of the food.
6
100 g
300 g
1 cup, sliced - 135g
Magnesium
Magnesium
Calcium
Calcium
Potassium
Potassium
Iron
Iron
Copper
Copper
Zinc
Zinc
Phosphorus
Phosphorus
Sodium
Sodium
Manganese
Manganese
Selenium
Selenium
13%
14%
25%
21%
23%
8.2%
24%
2.1%
27%
3.3%
3
100 g
300 g
Magnesium
Magnesium
Calcium
Calcium
Potassium
Potassium
Iron
Iron
Copper
Copper
Zinc
Zinc
Phosphorus
Phosphorus
Sodium
Sodium
Manganese
Manganese
Selenium
Selenium
14%
3.6%
11%
105%
199%
5.5%
4.7%
13%
24%
3.8%
Vitamin Comparison
Vitamin comparison score is based on the number of vitamins by which one or the other food is richer. The "coverage" charts below show how much of the daily needs can be covered by 300 grams of the food.
3
100 g
300 g
1 cup, sliced - 135g
Vitamin C
Vit. C
Vitamin D
Vit. D
Vitamin A
Vit. A
Vitamin E
Vit. E
Vitamin B1
Vit. B1
Vitamin B2
Vit. B2
Vitamin B3
Vit. B3
Vitamin B5
Vit. B5
Vitamin B6
Vit. B6
Vitamin B12
Vit. B12
Vitamin K
Vit. K
Folate
Folate
15%
0%
0%
3.8%
14%
40%
7.4%
17%
50%
0%
0.75%
11%
7
100 g
300 g
Vitamin C
Vit. C
Vitamin D
Vit. D
Vitamin A
Vit. A
Vitamin E
Vit. E
Vitamin B1
Vit. B1
Vitamin B2
Vit. B2
Vitamin B3
Vit. B3
Vitamin B5
Vit. B5
Vitamin B6
Vit. B6
Vitamin B12
Vit. B12
Vitamin K
Vit. K
Folate
Folate
3%
0%
1%
9.8%
56%
79%
22%
20%
7.8%
0%
6.3%
6.8%
All nutrients comparison - raw data values
Nutrient
DV% diff.
Copper
0.07mg
0.597mg
59%
Iron
0.55mg
2.79mg
28%
Vitamin B1
0.056mg
0.222mg
14%
Vitamin B6
0.218mg
0.034mg
14%
Vitamin B2
0.173mg
0.342mg
13%
Fiber
3.1g
0.4g
11%
Protein
2.73g
5.92g
6%
Phosphorus
56mg
11mg
6%
Potassium
283mg
127mg
5%
Vitamin B3
0.392mg
1.196mg
5%
Vitamin C
4.6mg
0.9mg
4%
Carbs
15.36g
2.42g
4%
Calcium
47mg
12mg
4%
Sodium
16mg
98mg
4%
Choline
25.9mg
6.5mg
4%
Calories
68kcal
26kcal
2%
Vitamin E
0.19mg
0.49mg
2%
Vitamin K
0.3µg
2.5µg
2%
Folate
15µg
9µg
2%
Zinc
0.3mg
0.2mg
1%
Manganese
0.21mg
0.186mg
1%
Vitamin B5
0.276mg
0.325mg
1%
Protein per 100 calories
4g
23g
N/A
Calories per 10 g protein
249kcal
44kcal
N/A
Weight per 100 calories
147g
385g
N/A
Fats
0.17g
0.39g
0%
Net carbs
12.26g
2.02g
N/A
Magnesium
18mg
19mg
0%
Sugar
2.9g
0.3g
N/A
Vitamin A
0µg
3µg
0%
Selenium
0.6µg
0.7µg
0%
Saturated fat
0.041g
0.135g
0%
Monounsaturated fat
0.003g
0.034g
0%
Polyunsaturated fat
0.074g
0.106g
0%
Tryptophan
0.096mg
0%
Threonine
0.306mg
0%
Isoleucine
0.331mg
0%
Leucine
0.509mg
0%
Lysine
0.312mg
0%
Methionine
0.118mg
0%
Phenylalanine
0.286mg
0%
Valine
0.362mg
0%
Histidine
0.112mg
0%
Macronutrient Comparison
Macronutrient breakdown side-by-side comparison
2
3%
15%
81%
Protein:
2.73 g
Fats:
0.17 g
Carbs:
15.36 g
Water:
81 g
Other:
0.74 g
3
6%
2%
91%
Protein:
5.92 g
Fats:
0.39 g
Carbs:
2.42 g
Water:
90.67 g
Other:
0.6 g
Contains
more
Carbs Carbs
+534.7%
Contains
more
Other Other
+23.3%
Contains
more
Protein Protein
+116.8%
Contains
more
Fats Fats
+129.4%
Contains
more
Water Water
+11.9%
Fat Type Comparison
Fat type breakdown side-by-side comparison
1
35%
3%
63%
Saturated fat:
Sat. Fat
0.041 g
Monounsaturated fat:
Mono. Fat
0.003 g
Polyunsaturated fat:
Poly. Fat
0.074 g
2
49%
12%
39%
Saturated fat:
Sat. Fat
0.135 g
Monounsaturated fat:
Mono. Fat
0.034 g
Polyunsaturated fat:
Poly. Fat
0.106 g
Contains
less
Sat. Fat Saturated fat
-69.6%
Contains
more
Mono. Fat Monounsaturated fat
+1033.3%
Contains
more
Poly. Fat Polyunsaturated fat
+43.2%