Saltine cracker (includes oyster, soda, soup) vs. Blackberry — In-Depth Nutrition Comparison
Compare
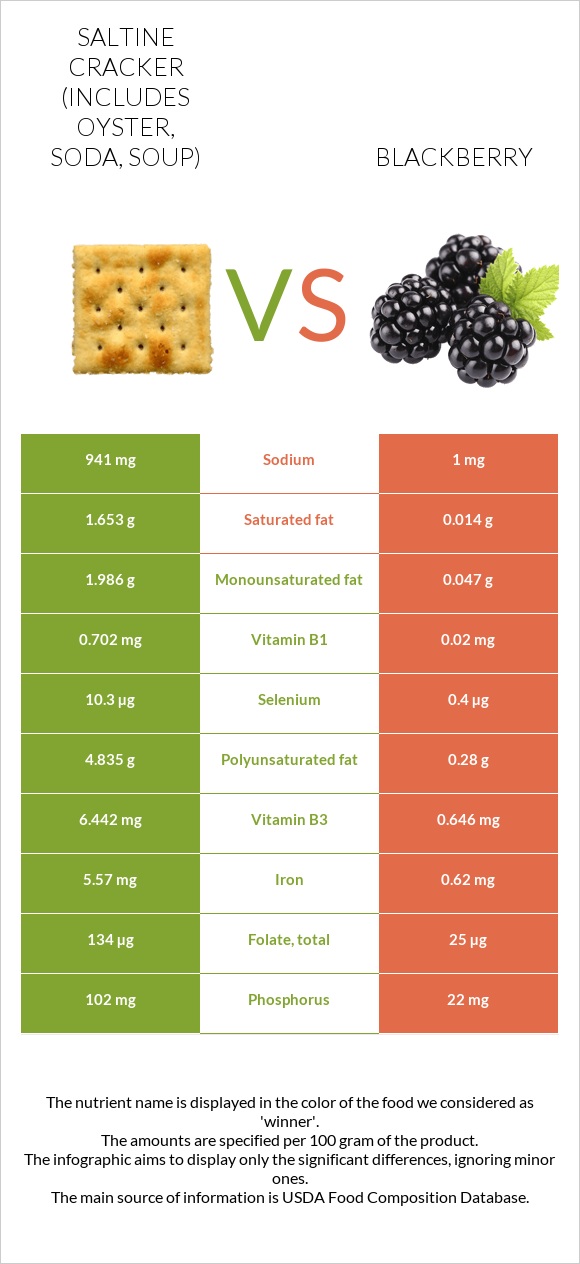
Significant differences between saltine cracker (includes oyster, soda, soup) and blackberries
- Saltine cracker (includes oyster, soda, soup) has more iron, vitamin B1, vitamin B3, vitamin B2, folate, selenium, and phosphorus; however, blackberries are richer in vitamin C and fiber.
- Saltine cracker (includes oyster, soda, soup) covers your daily iron needs 62% more than blackberries.
- Blackberries have 941 times less sodium than saltine cracker (includes oyster, soda, soup). Saltine cracker (includes oyster, soda, soup) has 941mg of sodium, while blackberries have 1mg.
- Saltine cracker (includes oyster, soda, soup) has a higher glycemic index. The glycemic index of saltine cracker (includes oyster, soda, soup) is 74, while the glycemic index of blackberries is 25.
Specific food types used in this comparison are Crackers, saltines (includes oyster, soda, soup) and Blackberries, raw.
Infographic
Infographic link
Mineral Comparison
Mineral comparison score is based on the number of minerals by which one or the other food is richer. The "coverage" charts below show how much of the daily needs can be covered by 300 grams of the food.
| Contains more MagnesiumMagnesium | +15% |
| Contains more IronIron | +798.4% |
| Contains more ZincZinc | +30.2% |
| Contains more PhosphorusPhosphorus | +363.6% |
| Contains more SeleniumSelenium | +2475% |
| Contains more CalciumCalcium | +52.6% |
| Contains more CopperCopper | +18.7% |
| Contains less SodiumSodium | -99.9% |
Vitamin Comparison
Vitamin comparison score is based on the number of vitamins by which one or the other food is richer. The "coverage" charts below show how much of the daily needs can be covered by 300 grams of the food.
| Contains more Vitamin B1Vitamin B1 | +3410% |
| Contains more Vitamin B2Vitamin B2 | +1773.1% |
| Contains more Vitamin B3Vitamin B3 | +897.2% |
| Contains more Vitamin B5Vitamin B5 | +94.2% |
| Contains more Vitamin B6Vitamin B6 | +186.7% |
| Contains more Vitamin B12Vitamin B12 | +∞% |
| Contains more Vitamin KVitamin K | +28.3% |
| Contains more FolateFolate | +436% |
| Contains more Vitamin CVitamin C | +∞% |
| Contains more Vitamin AVitamin A | +1000% |
All nutrients comparison - raw data values
| Nutrient |  |
 |
DV% diff. |
| Iron | 5.57mg | 0.62mg | 62% |
| Vitamin B1 | 0.702mg | 0.02mg | 57% |
| Sodium | 941mg | 1mg | 41% |
| Vitamin B3 | 6.442mg | 0.646mg | 36% |
| Vitamin B2 | 0.487mg | 0.026mg | 35% |
| Polyunsaturated fat | 4.835g | 0.28g | 30% |
| Starch | 67.83g | 0g | 28% |
| Folate | 134µg | 25µg | 27% |
| Vitamin C | 0mg | 21mg | 23% |
| Carbs | 74.05g | 9.61g | 21% |
| Calories | 418kcal | 43kcal | 19% |
| Selenium | 10.3µg | 0.4µg | 18% |
| Protein | 9.46g | 1.39g | 16% |
| Fats | 8.64g | 0.49g | 13% |
| Phosphorus | 102mg | 22mg | 11% |
| Fiber | 2.8g | 5.3g | 10% |
| Saturated fat | 1.653g | 0.014g | 7% |
| Vitamin B5 | 0.536mg | 0.276mg | 5% |
| Vitamin K | 25.4µg | 19.8µg | 5% |
| Monounsaturated fat | 1.986g | 0.047g | 5% |
| Vitamin B6 | 0.086mg | 0.03mg | 4% |
| Vitamin B12 | 0.09µg | 0µg | 4% |
| Copper | 0.139mg | 0.165mg | 3% |
| Fructose | 0.19g | 2.4g | 3% |
| Manganese | 0.686mg | 0.646mg | 2% |
| Magnesium | 23mg | 20mg | 1% |
| Calcium | 19mg | 29mg | 1% |
| Zinc | 0.69mg | 0.53mg | 1% |
| Vitamin A | 1µg | 11µg | 1% |
| Choline | 16.7mg | 8.5mg | 1% |
| Net carbs | 71.25g | 4.31g | N/A |
| Potassium | 152mg | 162mg | 0% |
| Sugar | 1.29g | 4.88g | N/A |
| Vitamin E | 1.15mg | 1.17mg | 0% |
| Trans fat | 0.167g | 0g | N/A |
| Tryptophan | 0.116mg | 0% | |
| Threonine | 0.268mg | 0% | |
| Isoleucine | 0.333mg | 0% | |
| Leucine | 0.652mg | 0% | |
| Lysine | 0.172mg | 0% | |
| Methionine | 0.147mg | 0% | |
| Phenylalanine | 0.45mg | 0% | |
| Valine | 0.399mg | 0% | |
| Histidine | 0.197mg | 0% | |
| Omega-3 - ALA | 0.535g | N/A | |
| Omega-3 - Eicosatrienoic acid | 0.001g | N/A | |
| Omega-6 - Gamma-linoleic acid | 0.018g | N/A | |
| Omega-6 - Eicosadienoic acid | 0.003g | N/A | |
| Omega-6 - Linoleic acid | 4.25g | N/A |
Macronutrient Comparison
Macronutrient breakdown side-by-side comparison
Protein:
9.46 g
Fats:
8.64 g
Carbs:
74.05 g
Water:
5.05 g
Other:
2.8 g
Protein:
1.39 g
Fats:
0.49 g
Carbs:
9.61 g
Water:
88.15 g
Other:
0.36 g
| Contains more ProteinProtein | +580.6% |
| Contains more FatsFats | +1663.3% |
| Contains more CarbsCarbs | +670.6% |
| Contains more OtherOther | +677.8% |
| Contains more WaterWater | +1645.5% |
Fat Type Comparison
Fat type breakdown side-by-side comparison
Saturated fat:
Sat. Fat
1.653 g
Monounsaturated fat:
Mono. Fat
1.986 g
Polyunsaturated fat:
Poly. Fat
4.835 g
Saturated fat:
Sat. Fat
0.014 g
Monounsaturated fat:
Mono. Fat
0.047 g
Polyunsaturated fat:
Poly. Fat
0.28 g
| Contains more Mono. FatMonounsaturated fat | +4125.5% |
| Contains more Poly. FatPolyunsaturated fat | +1626.8% |
| Contains less Sat. FatSaturated fat | -99.2% |
Carbohydrate type comparison
Carbohydrate type breakdown side-by-side comparison
Starch:
67.83 g
Sucrose:
0 g
Glucose:
0.12 g
Fructose:
0.19 g
Lactose:
0 g
Maltose:
0.98 g
Galactose:
0 g
Starch:
0 g
Sucrose:
0.07 g
Glucose:
2.31 g
Fructose:
2.4 g
Lactose:
0 g
Maltose:
0.07 g
Galactose:
0.03 g
| Contains more StarchStarch | +∞% |
| Contains more MaltoseMaltose | +1300% |
| Contains more SucroseSucrose | +∞% |
| Contains more GlucoseGlucose | +1825% |
| Contains more FructoseFructose | +1163.2% |
| Contains more GalactoseGalactose | +∞% |
~equal in
Lactose
~0g