Blackberry Nutrition & Calories - Complete data of all nutrients
Summary
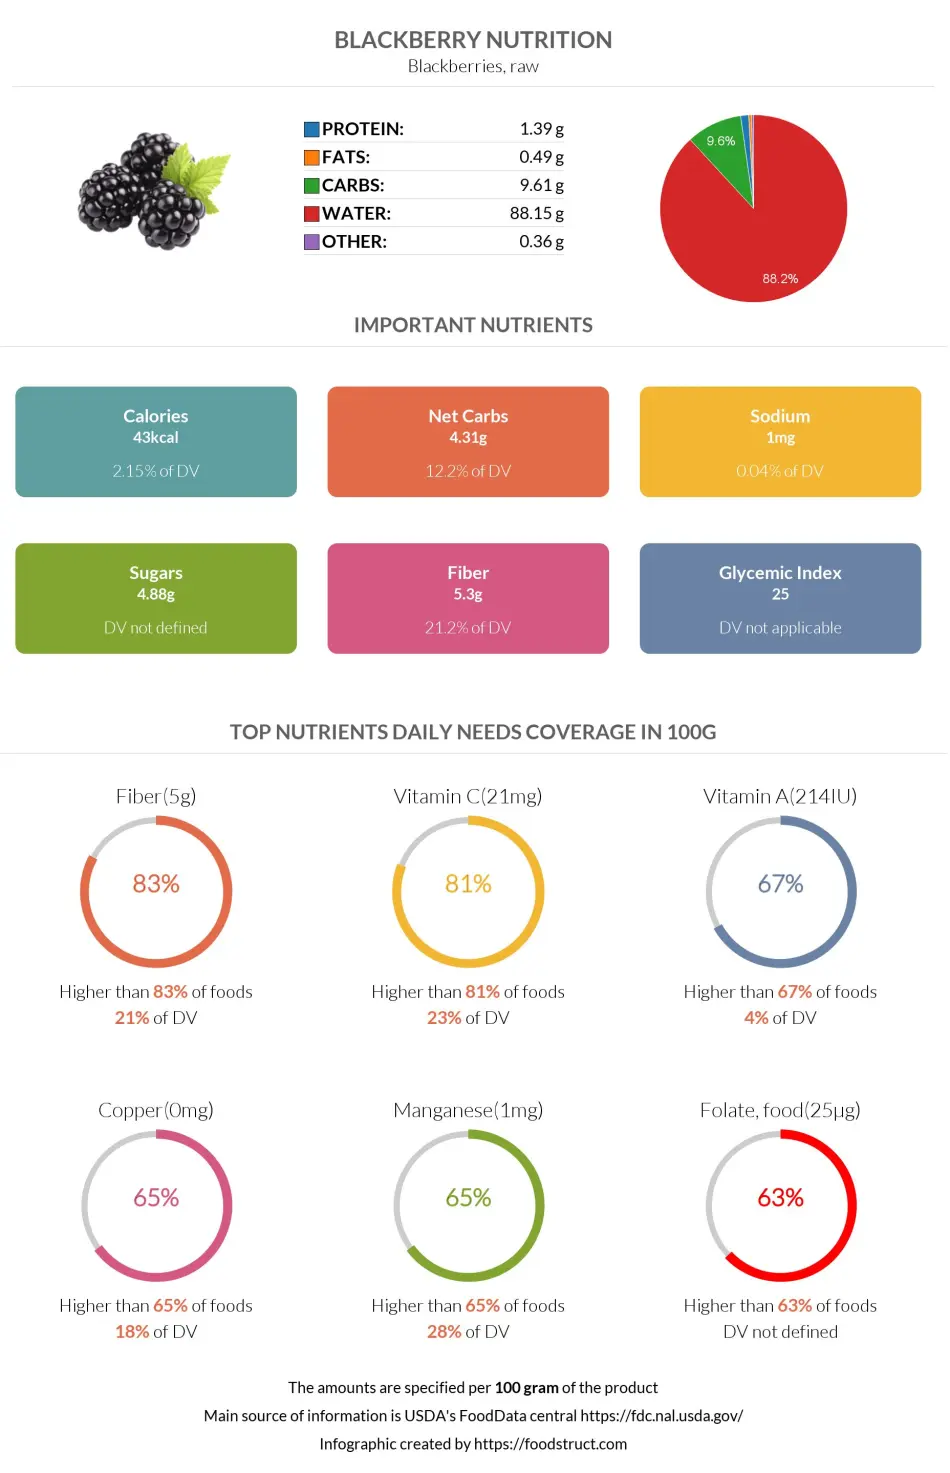
Blackberries are an excellent source of insoluble dietary fiber, vitamin C, vitamin K, manganese, and copper. Additionally, these berries are rich in antioxidants, such as anthocyanins, giving them various health-beneficial qualities.
Introduction
Blackberries are known as healthy snacks and delicious additions to fruit salads, yogurts, pastries, and more. But what exactly gives these berries their favorable qualities? In this article, we will discuss the nutritional content of blackberries in detail to see what sets this fruit apart from others.
Nutrition
The nutritional information below will be presented mainly for raw blackberries. However, key differences will also be mentioned between raw and frozen, unsweetened blackberries (1).
Like most other fruits, blackberries are not very dense in nutrients, consisting of 89% water and 11% macro and micronutrients.
However, frozen blackberries lose water and contain 82% water and 18% nutrients.
The average serving size of blackberries per person is one cup or 144g.
Macronutrients chart
Calories
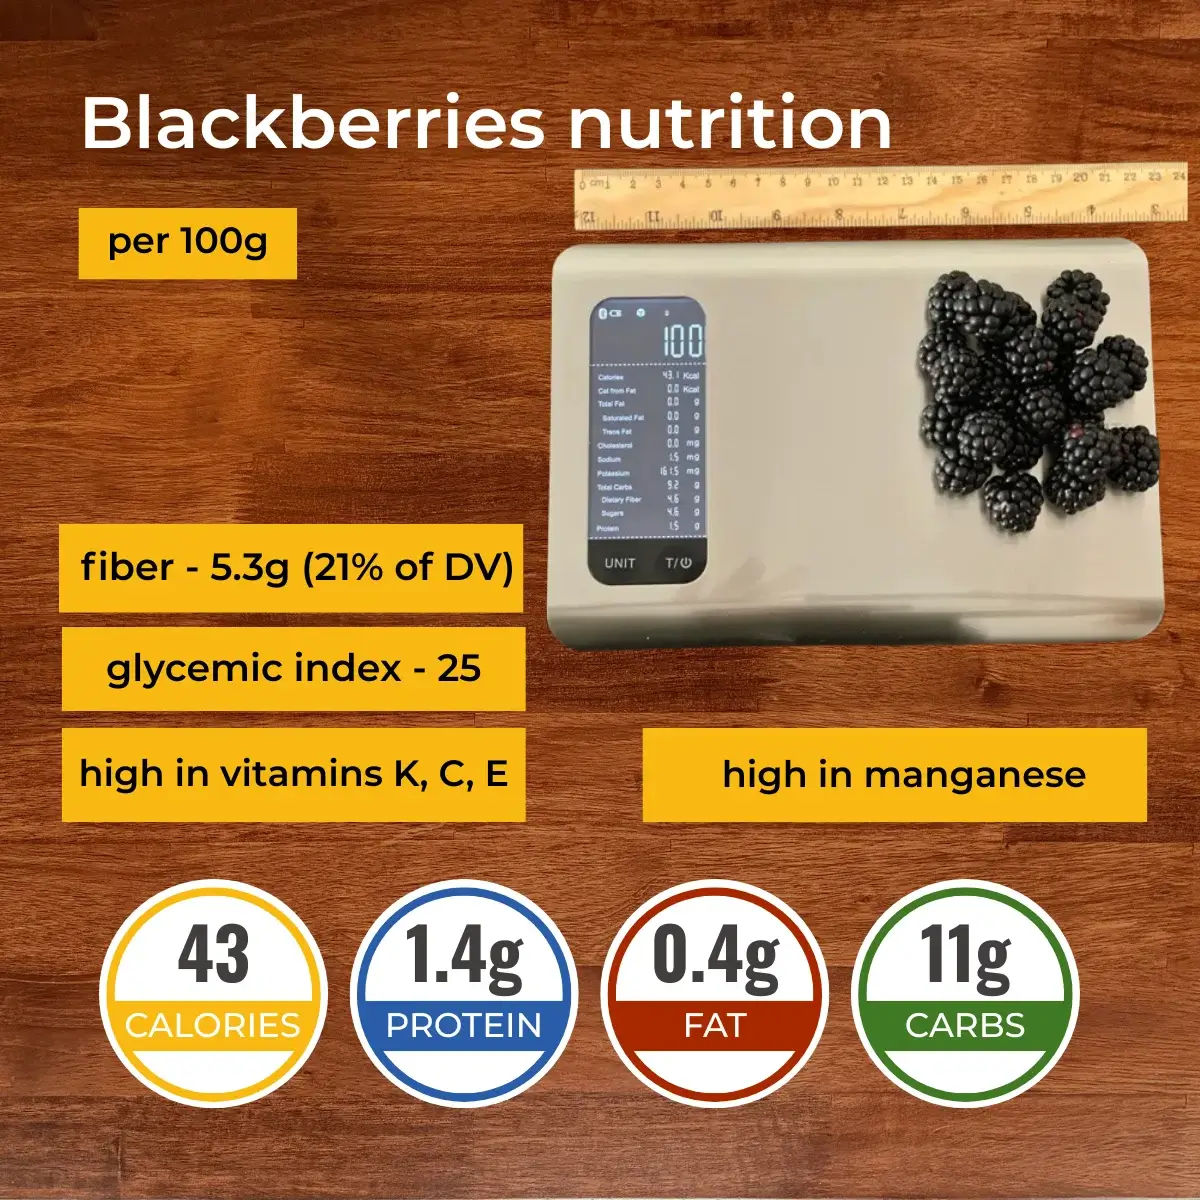
Blackberries are low in calories, providing only 43kcal per 100g serving. Consequently, one average serving size of blackberries contains 62 calories.
Frozen blackberries, being denser in nutrients, provide 21 additional calories per every 100g.
What Does 43 Calories or 100 Grams of Blackberry Look Like?
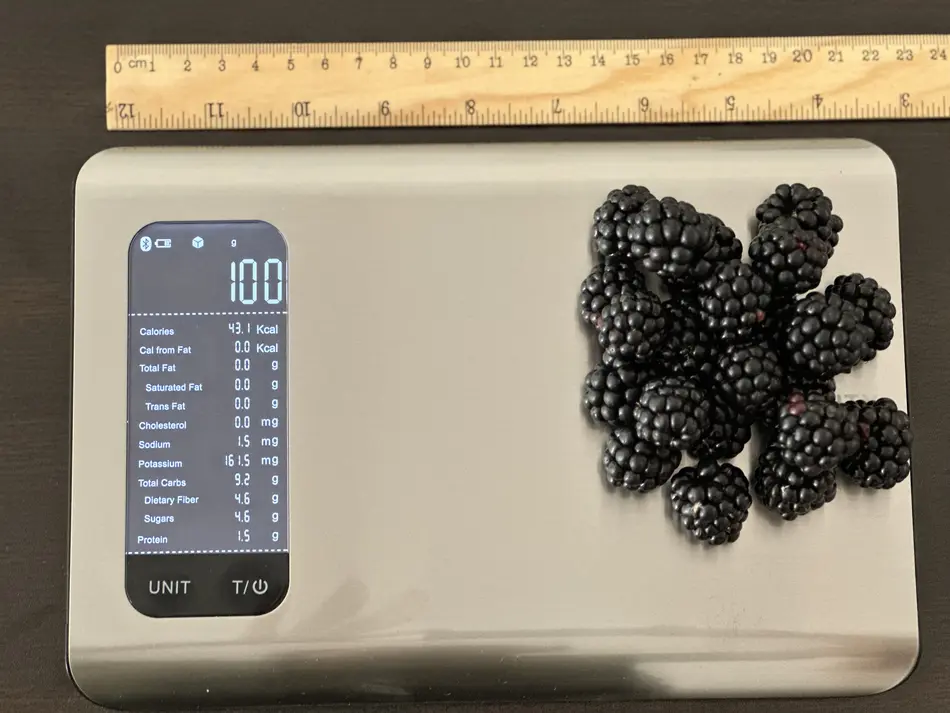
The photo below will help you visualize what 100 grams of blackberries look like. We measured 22 medium-sized blackberries, which comprised 100 grams (43 calories), meaning each blackberry is approximately 4.55 grams or 1.95 calories. These numbers can vary depending on the blackberries' size, ripeness, and weight. Unripe blackberries have lower sugar levels and fewer calories than fully ripe ones.
Protein
One average serving (144 grams) of blackberries provides 2g of protein.
Carbohydrates
Most of the macronutrient content of blackberries is made up of carbohydrates. In every 100g serving, about 10g of carbohydrates can be found. Overall, the carbohydrates of blackberries consist of 48% net carbs and 52% dietary fiber.
Dietary Fiber
Blackberries provide 5.3g of dietary fiber per every 100g serving. This puts blackberries in the top 17% of foods as a source of fiber and covers 21% of the daily fiber needs.
Blackberries are 2.2 times richer in dietary fiber than oranges, which are well known for their high fiber content.
The dietary fiber content of blackberries consists predominantly, about 92 to 97%, of insoluble fiber (2, 3). Insoluble fiber lets food pass through the digestive tract quicker, helping to prevent constipation.
Fiber content ratio for Blackberry
Net Carbs
A 100g serving of blackberries contains 4.9g of net carbs. All of these net carbs are made up of sugars, predominantly fructose and glucose, while also containing small amounts of sucrose, maltose, and galactose.
Unsweetened frozen blackberries, being nutritionally denser, can contain 5g more sugars per 100g serving.
The total sugar content, including glucose and fructose, can notably increase as the fruit matures (4).
Carbohydrate type breakdown
Fats
Blackberries contain a negligible amount of fats – less than half a gram per 100g serving.
Plant-based products do not contain cholesterol. Naturally, blackberries are no exception.
Fat type information
Vitamins
Blackberries can be an excellent vitamin-rich snack to add to any diet. The predominant vitamins found in blackberries are vitamin C and vitamin K.
Blackberries fall in the top 19% of foods as a source of vitamin C. A 100g serving of these berries covers 23% of the daily need for this vitamin. The same serving can also provide 17% of the daily required amount of vitamin K.
These berries are in the top 33% of foods as a source of vitamin A. However, as the daily vitamin A requirement is relatively high, a 100g serving covers only 4%.
Blackberry can be a good source of tocopherols or vitamin E and folate or vitamin B9 as well. It contains vitamins B1 (thiamin), B2 (riboflavin), B3 (niacin), B5 (pantothenic acid), and B6 (pyridoxine) in smaller amounts.
Blackberries lack vitamin D and vitamin B12 entirely.
Vitamin coverage chart
Minerals
Blackberries are great sources of manganese and copper, falling in the top 35% of foods as a source of these minerals. A 100g of blackberries covers 28% and 18% of the daily needed values of manganese and copper, respectively.
These berries can also be a good source of iron. Other minerals found in blackberries in moderate amounts include magnesium, potassium, and zinc.
Blackberries are very low in sodium, containing only 1mg in a 100g serving.
Mineral coverage chart
Oxalates
Oxalates are compounds found in plants, which, when consumed, may bind to calcium, increasing the risk of kidney stone formation.
The research behind the oxalate content in blackberries is quite contradictory, with some listing them next to blueberries as low-oxalate foods. A study by Han et al. states that blackberries contain 19mg of oxalates per 100-gram serving, which can be considered low to moderate levels of oxalates (8).
Phytochemicals
Blackberries are abundant in health-beneficial plant nutrients, which provide antioxidant and anti-inflammatory properties and help fight various diseases, including cancer and heart disease (13).
Terpenoids
A recent study by Gil-Martinez et al. states that terpenoids and phenolic compounds are the major phytochemicals found in blackberries (12). Not only do the authors quantify the terpenoid content in blackberries, but they also discuss that terpenoids have been demonstrated to be effective antitumor, antibacterial, and antiviral agents.
Anthocyanins
The most notable of these phytochemicals may be the phenolic pigment anthocyanin. This compound is what gives blackberries their distinct dark coloring. The darker the berry, the richer it is in anthocyanins.
Anthocyanins, like other flavonoids, are strong antioxidants that help prevent cell damage by reducing the formation of harmful reactive oxygen species.
The anthocyanin content of blackberries increases as the fruit matures (5).
Phenolic Compounds
Other antioxidant phenolic compounds found in blackberries are gallic acid, hydroxybenzoic acid, catechin, epicatechin, caffeic acid, ferulic acid, ellagic acid, and quercetin.
The levels of gallic acid, hydroxybenzoic acid, epicatechin, and ellagic acid increase with maturation, while catechin, caffeic acid, and quercetin levels decrease (5).
It is interesting to note that in a study by Avila-Nava et al., the authors compared over 100 different foods for their oxalate content and antioxidant activity and observed that blackberries and strawberries exhibited the highest antioxidant activity, which was attributed to their polyphenol content (9).
Malic Acid
The primary organic acid found in blackberries is malic acid. This compound is responsible for the tart taste of blackberries. However, malic acid also stabilizes the anthocyanins and extends the shelf life of these berries (4).
The malic acid content of blackberries decreases as they mature.
Lignans
Lignans are phytoestrogen compounds found in blackberries that can play an important role in preventing certain types of breast cancer and cardiovascular diseases (4).
Glycemic Index
An exact number has not yet been measured for the glycemic index of blackberries. However, this number is assumed to fall in the low category.
Blackberry extract has been researched to have hypoglycemic and antidiabetic qualities, decreasing blood glucose levels and improving insulin sensitivity in diabetic rats (6, 7).
Acidity
Blackberries are acidic. However, the pH value of blackberries gets less acidic as they mature, going from 2.3 to 2.9 (5).
Another way of looking at the acidity of foods is the potential renal load value or the PRAL, which measures how much acid or base the given food produces inside the body.
Blackberries have a PRAL value of -2.8, making them alkaline-forming.
FODMAPS
Monash University has established the low-fodmap diet to help patients struggling with various gastric disturbances (including IBS) identify their triggers and manage their symptoms (10).
Blackberries are especially high in polyols, which makes them unsuitable for the low-fodmap diet, although portion size and ripeness play a big role as well (11).
Nutritional Comparison of Wild and Cultivated Blackberries
In a study where domesticated and wild blackberries from Mexico were compared for their anthocyanin contents, it was found that wild blackberries had much higher levels of anthocyanins than commercial or cultivated varieties, hinting that depending on the type of blackberry you eat, the health benefits may vary (14).
Another study used three different methods to compare the antioxidant activity of wild and cultivated blackberries and found that the wild blackberries showed the highest antioxidant activity in all measurements (15). Moreover, the total phenolic content in wild blackberries was much higher compared to cultivated blackberries.
Hence, although wild and cultivated blackberries are rich in various nutrients essential for health, wild blackberries are richer in various phytochemicals and, thus, in antioxidant activity.
Comparison to Similar Foods
Compared to mulberries, blackberries are higher in fiber, vitamin A, vitamin E, vitamin K, copper, and zinc. In contrast, mulberries are richer in sugars, vitamin C, vitamin B2, iron, calcium, potassium, and phosphorus.
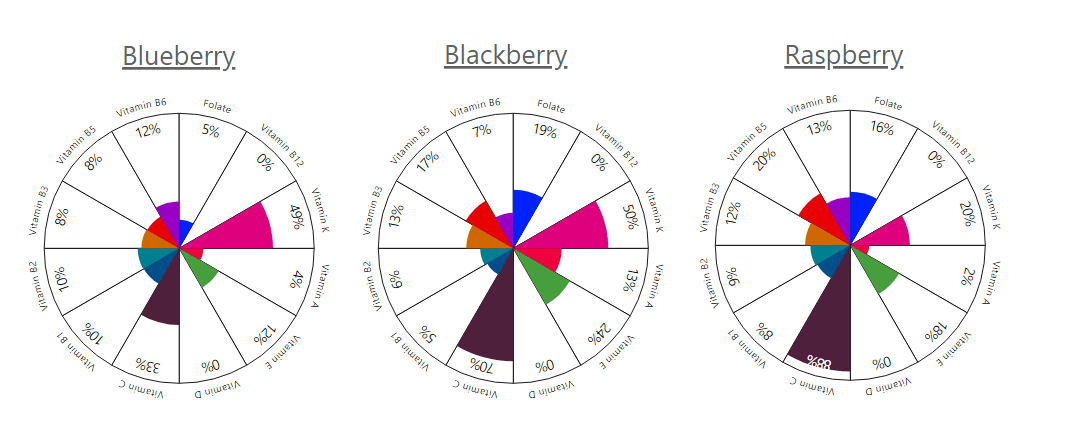
Compared to blueberries, blackberries contain more vitamin C and fewer carbohydrates, including sugars. At the same time, blueberries are richer in vitamins B1, B5, and B6.
Blackberries contain more fiber, manganese, copper, vitamins A, E, and K than raspberries. Raspberries, however, have higher amounts of magnesium, vitamin C, and folate.
If interested, you can read the full articles comparing the nutrition and health impact of “Blackberry vs. Mulberry,” “Blackberry vs. Blueberry,” and “Blackberry vs. Raspberry.”
References
- https://fdc.nal.usda.gov/fdc-app.html#/food-details/171710/nutrients
- https://sci.washington.edu/info/forums/reports/FiberFacts.pdf
- Blackberry Fruit: Nutrition Facts and Health Benefits
- https://pubmed.ncbi.nlm.nih.gov/22082199/
- https://www.researchgate.net/publication/272652580
- https://www.researchgate.net/publication/256611121
- https://www.researchgate.net/publication/326920126
- https://www.ncbi.nlm.nih.gov/pmc/articles/PMC4525130/
- https://pubmed.ncbi.nlm.nih.gov/32709427/
- https://onlinelibrary.wiley.com/doi/full/10.1111/jgh.13685
- https://www.ncbi.nlm.nih.gov/pmc/articles/PMC4918736/
- https://www.ncbi.nlm.nih.gov/pmc/articles/PMC10094647/
- https://www.ncbi.nlm.nih.gov/pmc/articles/PMC4638072/
- https://pubmed.ncbi.nlm.nih.gov/20507066/
- https://www.researchgate.net/publication/236593987

Top nutrition facts for Blackberry
| Calories ⓘ Calories for selected serving | 43 kcal |
| Glycemic index ⓘ Gi values are taken from various scientific sources. GI values less than 55 are considered as low. Values above 70 are considered as high. | 25 (low) |
| Glycemic load ⓘ Glycemic Load (GL) is a metric that measures both the quality (Glycemic Index) and quantity of carbohydrates in a specific serving of food to estimate its impact on blood sugar levels. It is calculated as: (GI × Carbs in grams) / 100. | 2 (low) |
| Net carbs ⓘ Net Carbs = Total Carbohydrates – Fiber – Sugar Alcohols | 4 g |
| Default serving size ⓘ Serving sizes are mostly taken from FDA's Reference Amounts Customarily Consumed (RACCs) | 1 cup (144 g) |
| Acidity (Based on PRAL) ⓘ PRAL (Potential renal acid load) is calculated using a formula. On the PRAL scale the higher the positive value, the more is the acidifying effect on the body. The lower the negative value, the higher the alkalinity of the food. 0 is neutral. | -2.8 (alkaline) |
| Oxalates | 29 mg ⓘ https://www.ncbi.nlm.nih.gov/pmc/articles/PMC8229448/ |
Blackberry calories (kcal)
| Calories for different serving sizes of blackberry | Calories | Weight |
|---|---|---|
| Calories in 100 grams | 43 | |
| Calories in 1 cup | 62 | 144 g |
| Calories for different varieties of blackberry | Calories | Weight |
|---|---|---|
| Blackberries, raw (this food) | 43 | 100 g |
| Blackberries, wild, raw (Alaska Native) | 52 | 100 g |
Extra Nutrition facts for Blackberry
| Protein per 100 calories ⓘ Shows how many grams of protein you get from 100 calories of this food, calculated as (protein in g ÷ calories) × 100. | 3.2 g |
| Calories per 10 g protein ⓘ Shows how many calories you need to eat from this food to get 10 g of protein, calculated as (calories ÷ protein in g) × 10. | 309 kcal |
| Weight per 100 calories ⓘ Shows how many grams of this food equal 100 kcal—higher grams mean a larger portion for the same calories. | 233 g |
Blackberry Glycemic index (GI)
Blackberry Glycemic load (GL)
Mineral chart - relative view
Vitamin chart - relative view
All nutrients for Blackberry per 100g
| Nutrient | Value | DV% | In TOP % of foods | Comparison |
| Vitamin A | 11µg | 1% | 33% | |
| Calories | 43kcal | 2% | 90% |
1.1 times less than Orange
|
| Calories per 10 g protein | 309kcal | N/A | 38% | |
| Weight per 100 calories | 233g | N/A | 11% | |
| Protein per 100 calories | 3.2g | N/A | 59% | |
| Protein | 1.4g | 3% | 83% |
2 times less than Broccoli
|
| Fats | 0.49g | 1% | 81% |
68 times less than Cheese
|
| Vitamin C | 21mg | 23% | 10% |
2.5 times less than Lemon
|
| Carbs | 9.6g | 3% | 50% |
2.9 times less than Rice
|
| Net carbs | 4.3g | N/A | 59% |
12.6 times less than Chocolate
|
| Cholesterol | 0mg | 0% | 100% |
N/A
|
| Vitamin D* | 0 IU | 0% | 100% |
N/A
|
| Vitamin D | 0µg | 0% | 100% |
N/A
|
| Magnesium | 20mg | 5% | 53% |
7 times less than Almonds
|
| Calcium | 29mg | 3% | 41% |
4.3 times less than Milk
|
| Potassium | 162mg | 5% | 64% |
1.1 times more than Cucumber
|
| Iron | 0.62mg | 8% | 71% |
4.2 times less than Beef broiled
|
| Sugar | 4.9g | N/A | 28% |
1.8 times less than Coca-Cola
|
| Fiber | 5.3g | 21% | 11% |
2.2 times more than Orange
|
| Copper | 0.17mg | 18% | 21% |
1.2 times more than Shiitake
|
| Zinc | 0.53mg | 5% | 60% |
11.9 times less than Beef broiled
|
| Starch | 0g | 0% | 100% |
N/A
|
| Phosphorus | 22mg | 3% | 81% |
8.3 times less than Chicken meat
|
| Sodium | 1mg | 0% | 97% |
490 times less than White bread
|
| Vitamin E | 1.2mg | 8% | 12% |
1.2 times less than Kiwi
|
| Manganese | 0.65mg | 28% | 11% | |
| Selenium | 0.4µg | 1% | 72% | |
| Vitamin B1 | 0.02mg | 2% | 81% |
13.3 times less than Pea raw
|
| Vitamin B2 | 0.03mg | 2% | 82% |
5 times less than Avocado
|
| Vitamin B3 | 0.65mg | 4% | 68% |
14.8 times less than Turkey meat
|
| Vitamin B5 | 0.28mg | 6% | 51% |
4.1 times less than Sunflower seeds
|
| Vitamin B6 | 0.03mg | 2% | 78% |
4 times less than Oats
|
| Vitamin B12 | 0µg | 0% | 100% |
N/A
|
| Vitamin K | 20µg | 17% | 7% |
5.1 times less than Broccoli
|
| Trans fat | 0g | N/A | 100% |
N/A
|
| Folate | 25µg | 6% | 31% |
2.4 times less than Brussels sprouts
|
| Saturated fat | 0.01g | 0% | 89% |
421.1 times less than Beef broiled
|
| Choline | 8.5mg | 2% | 42% | |
| Monounsaturated fat | 0.05g | N/A | 78% |
208.5 times less than Avocado
|
| Polyunsaturated fat | 0.28g | N/A | 66% |
168.5 times less than Walnut
|
| Fructose | 2.4g | 3% | 3% |
2.5 times less than Apple
|
| Caffeine | 0mg | 0% | 100% | |
| Omega-3 - EPA | 0g | N/A | 100% |
N/A
|
| Omega-3 - DHA | 0g | N/A | 100% |
N/A
|
| Omega-3 - DPA | 0g | N/A | 100% |
N/A
|
Check out similar food or compare with current
NUTRITION FACTS LABEL
Serving Size ______________
Health checks
Blackberry nutrition infographic
References
All the values for which the sources are not specified explicitly are taken from FDA’s Food Central. The exact link to the food presented on this page can be found below.