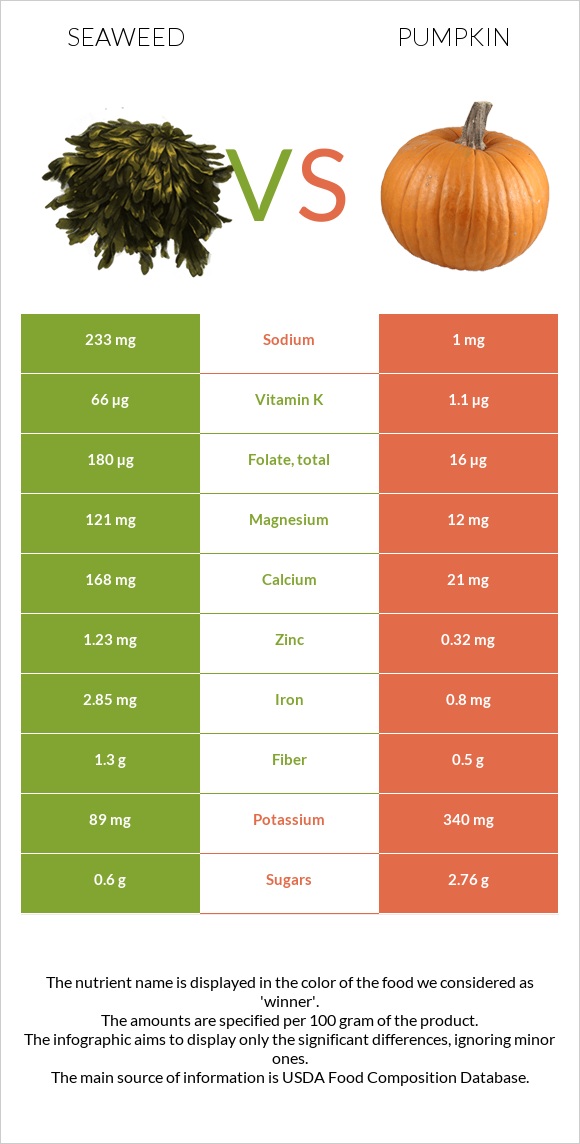
How are seaweed and pumpkins different? Seaweed is richer in vitamin K, folate, iron, magnesium, calcium, zinc, vitamin B5, and vitamin B2, while pumpkins are higher in vitamin A. Pumpkins cover your daily need for vitamin A, 113% more than seaweed. Seaweed contains 233 times more sodium than pumpkins. Seaweed contains 233mg of sodium, while pumpkins contain 1mg. Seaweed, kelp, raw and Pumpkin, cooked, boiled, drained, without salt types were used in this article.
Infographic
Mineral Comparison
Mineral comparison score is based on the number of minerals by which one or the other food is richer. The "coverage" charts below show how much of the daily needs can be covered by 300 grams of the food.
8
100 g
300 g
2 tbsp (1/8 cup) - 10g
Magnesium
Magnesium
Calcium
Calcium
Potassium
Potassium
Iron
Iron
Copper
Copper
Zinc
Zinc
Phosphorus
Phosphorus
Sodium
Sodium
Manganese
Manganese
Selenium
Selenium
86%
50%
7.9%
107%
43%
34%
18%
30%
26%
3.8%
2
100 g
300 g
1 cup, mashed - 245g
Magnesium
Magnesium
Calcium
Calcium
Potassium
Potassium
Iron
Iron
Copper
Copper
Zinc
Zinc
Phosphorus
Phosphorus
Sodium
Sodium
Manganese
Manganese
Selenium
Selenium
6.4%
4.5%
20%
21%
30%
6.3%
13%
0.13%
12%
1.1%
Vitamin Comparison
Vitamin comparison score is based on the number of vitamins by which one or the other food is richer. The "coverage" charts below show how much of the daily needs can be covered by 300 grams of the food.
6
100 g
300 g
2 tbsp (1/8 cup) - 10g
Vitamin C
Vit. C
Vitamin D
Vit. D
Vitamin A
Vit. A
Vitamin E
Vit. E
Vitamin B1
Vit. B1
Vitamin B2
Vit. B2
Vitamin B3
Vit. B3
Vitamin B5
Vit. B5
Vitamin B6
Vit. B6
Vitamin B12
Vit. B12
Vitamin K
Vit. K
Folate
Folate
10%
0%
2%
17%
13%
35%
8.8%
39%
0.46%
0%
165%
135%
3
100 g
300 g
1 cup, mashed - 245g
Vitamin C
Vit. C
Vitamin D
Vit. D
Vitamin A
Vit. A
Vitamin E
Vit. E
Vitamin B1
Vit. B1
Vitamin B2
Vit. B2
Vitamin B3
Vit. B3
Vitamin B5
Vit. B5
Vitamin B6
Vit. B6
Vitamin B12
Vit. B12
Vitamin K
Vit. K
Folate
Folate
16%
0%
96%
16%
7.8%
18%
7.7%
12%
10%
0%
2%
6.8%
All nutrients comparison - raw data values
Nutrient
DV% diff.
Vitamin K
66µg
0.8µg
54%
Folate
180µg
9µg
43%
Vitamin A
6µg
288µg
31%
Iron
2.85mg
0.57mg
29%
Magnesium
121mg
9mg
27%
Calcium
168mg
15mg
15%
Sodium
233mg
1mg
10%
Zinc
1.23mg
0.23mg
9%
Vitamin B5
0.642mg
0.201mg
9%
Vitamin B2
0.15mg
0.078mg
6%
Manganese
0.2mg
0.089mg
5%
Potassium
89mg
230mg
4%
Copper
0.13mg
0.091mg
4%
Vitamin B6
0.002mg
0.044mg
3%
Protein
1.68g
0.72g
2%
Vitamin C
3mg
4.7mg
2%
Carbs
9.57g
4.9g
2%
Phosphorus
42mg
30mg
2%
Vitamin B1
0.05mg
0.031mg
2%
Calories
43kcal
20kcal
1%
Fats
0.56g
0.07g
1%
Fiber
1.3g
1.1g
1%
Selenium
0.7µg
0.2µg
1%
Choline
12.8mg
6.2mg
1%
Saturated fat
0.247g
0.037g
1%
Protein per 100 calories
3.9g
3.6g
N/A
Calories per 10 g protein
256kcal
278kcal
N/A
Weight per 100 calories
233g
500g
N/A
Net carbs
8.27g
3.8g
N/A
Sugar
0.6g
2.08g
N/A
Vitamin E
0.87mg
0.8mg
0%
Vitamin B3
0.47mg
0.413mg
0%
Monounsaturated fat
0.098g
0.009g
0%
Polyunsaturated fat
0.047g
0.004g
0%
Tryptophan
0.048mg
0.009mg
0%
Threonine
0.055mg
0.021mg
0%
Isoleucine
0.076mg
0.023mg
0%
Leucine
0.083mg
0.034mg
0%
Lysine
0.082mg
0.039mg
0%
Methionine
0.025mg
0.008mg
0%
Phenylalanine
0.043mg
0.023mg
0%
Valine
0.072mg
0.025mg
0%
Histidine
0.024mg
0.011mg
0%
Omega-3 - EPA
0.004g
0g
N/A
Macronutrient Comparison
Macronutrient breakdown side-by-side comparison
4
2%
10%
82%
7%
Protein:
1.68 g
Fats:
0.56 g
Carbs:
9.57 g
Water:
81.58 g
Other:
6.61 g
1
5%
94%
Protein:
0.72 g
Fats:
0.07 g
Carbs:
4.9 g
Water:
93.69 g
Other:
0.62 g
Contains
more
Protein Protein
+133.3%
Contains
more
Fats Fats
+700%
Contains
more
Carbs Carbs
+95.3%
Contains
more
Other Other
+966.1%
Contains
more
Water Water
+14.8%
Fat Type Comparison
Fat type breakdown side-by-side comparison
2
63%
25%
12%
Saturated fat:
Sat. Fat
0.247 g
Monounsaturated fat:
Mono. Fat
0.098 g
Polyunsaturated fat:
Poly. Fat
0.047 g
1
74%
18%
8%
Saturated fat:
Sat. Fat
0.037 g
Monounsaturated fat:
Mono. Fat
0.009 g
Polyunsaturated fat:
Poly. Fat
0.004 g
Contains
more
Mono. Fat Monounsaturated fat
+988.9%
Contains
more
Poly. Fat Polyunsaturated fat
+1075%
Contains
less
Sat. Fat Saturated fat
-85%