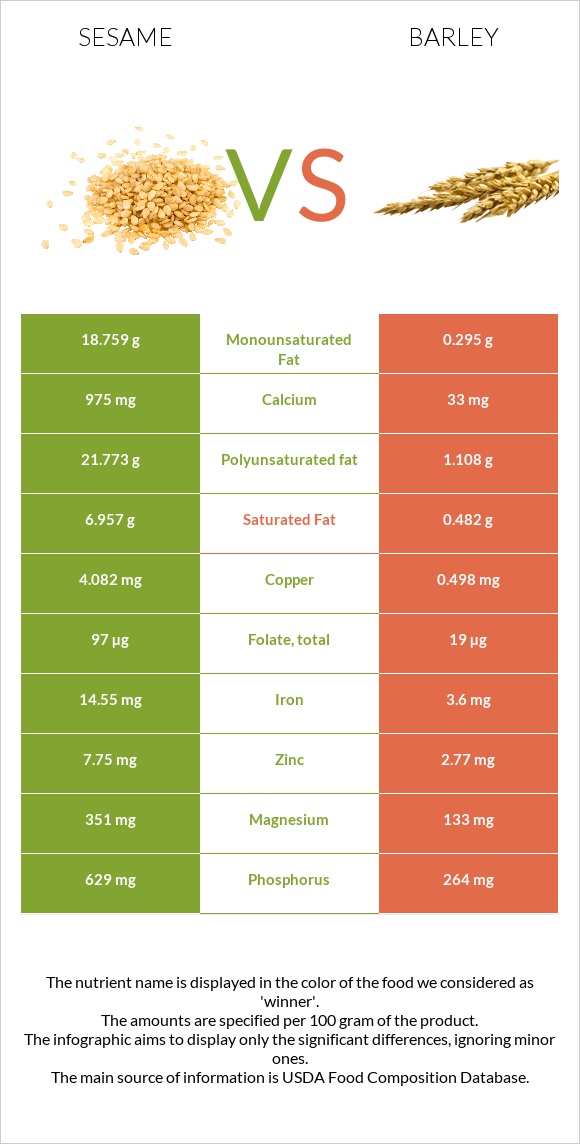
How are sesame and barley different? Sesame has more copper, iron, calcium, manganese, phosphorus, magnesium, zinc, vitamin B1, vitamin B6, and selenium than barley. Daily need coverage for copper for sesame is 442% higher. Sesame contains 89 times more calcium than barley. While sesame contains 975mg of calcium, barley contains only 11mg. Seeds, sesame seeds, whole, dried and Barley, pearled, cooked are the varieties used in this article.
Infographic
Mineral Comparison
Mineral comparison score is based on the number of minerals by which one or the other food is richer. The "coverage" charts below show how much of the daily needs can be covered by 300 grams of the food.
9
100 g
300 g
1 tbsp - 9g 1 cup - 144g
Magnesium
Magnesium
Calcium
Calcium
Potassium
Potassium
Iron
Iron
Copper
Copper
Zinc
Zinc
Phosphorus
Phosphorus
Sodium
Sodium
Manganese
Manganese
Selenium
Selenium
251%
293%
41%
546%
1361%
211%
270%
1.4%
321%
188%
1
100 g
300 g
1 cup - 157g
Magnesium
Magnesium
Calcium
Calcium
Potassium
Potassium
Iron
Iron
Copper
Copper
Zinc
Zinc
Phosphorus
Phosphorus
Sodium
Sodium
Manganese
Manganese
Selenium
Selenium
16%
3.3%
8.2%
50%
35%
22%
23%
0.39%
34%
47%
Vitamin Comparison
Vitamin comparison score is based on the number of vitamins by which one or the other food is richer. The "coverage" charts below show how much of the daily needs can be covered by 300 grams of the food.
6
100 g
300 g
1 tbsp - 9g 1 cup - 144g
Vitamin C
Vit. C
Vitamin D
Vit. D
Vitamin A
Vit. A
Vitamin E
Vit. E
Vitamin B1
Vit. B1
Vitamin B2
Vit. B2
Vitamin B3
Vit. B3
Vitamin B5
Vit. B5
Vitamin B6
Vit. B6
Vitamin B12
Vit. B12
Vitamin K
Vit. K
Folate
Folate
0%
0%
0%
5%
198%
57%
85%
3%
182%
0%
0%
73%
2
100 g
300 g
1 cup - 157g
Vitamin C
Vit. C
Vitamin D
Vit. D
Vitamin A
Vit. A
Vitamin E
Vit. E
Vitamin B1
Vit. B1
Vitamin B2
Vit. B2
Vitamin B3
Vit. B3
Vitamin B5
Vit. B5
Vitamin B6
Vit. B6
Vitamin B12
Vit. B12
Vitamin K
Vit. K
Folate
Folate
0%
0%
0%
0.2%
21%
14%
39%
8.1%
27%
0%
2%
12%
All nutrients comparison - raw data values
Nutrient
DV% diff.
Copper
4.082mg
0.105mg
442%
Iron
14.55mg
1.33mg
165%
Polyunsaturated fat
21.773g
0.214g
144%
Calcium
975mg
11mg
96%
Manganese
2.46mg
0.259mg
96%
Phosphorus
629mg
54mg
82%
Magnesium
351mg
22mg
78%
Fats
49.67g
0.44g
76%
Zinc
7.75mg
0.82mg
63%
Vitamin B1
0.791mg
0.083mg
59%
Vitamin B6
0.79mg
0.115mg
52%
Selenium
34.4µg
8.6µg
47%
Monounsaturated fat
18.759g
0.057g
47%
Fiber
11.8g
3.8g
32%
Protein
17.73g
2.26g
31%
Saturated fat
6.957g
0.093g
31%
Calories
573kcal
123kcal
23%
Folate
97µg
16µg
20%
Vitamin B3
4.515mg
2.063mg
15%
Vitamin B2
0.247mg
0.062mg
14%
Potassium
468mg
93mg
11%
Carbs
23.45g
28.22g
2%
Vitamin E
0.25mg
0.01mg
2%
Vitamin B5
0.05mg
0.135mg
2%
Choline
25.6mg
13.4mg
2%
Vitamin K
0µg
0.8µg
1%
Protein per 100 calories
3.1g
1.8g
N/A
Calories per 10 g protein
323kcal
544kcal
N/A
Weight per 100 calories
17g
81g
N/A
Unsaturated / Saturated Fat ratio
5.8
2.9
N/A
Net carbs
11.65g
24.42g
N/A
Sugar
0.3g
0.28g
N/A
Sodium
11mg
3mg
0%
Tryptophan
0.388mg
0.038mg
0%
Threonine
0.736mg
0.077mg
0%
Isoleucine
0.763mg
0.083mg
0%
Leucine
1.358mg
0.154mg
0%
Lysine
0.569mg
0.084mg
0%
Methionine
0.586mg
0.043mg
0%
Phenylalanine
0.94mg
0.127mg
0%
Valine
0.99mg
0.111mg
0%
Histidine
0.522mg
0.051mg
0%
Macronutrient Comparison
Macronutrient breakdown side-by-side comparison
3
18%
50%
23%
5%
4%
Protein:
17.73 g
Fats:
49.67 g
Carbs:
23.45 g
Water:
4.69 g
Other:
4.46 g
2
2%
28%
69%
Protein:
2.26 g
Fats:
0.44 g
Carbs:
28.22 g
Water:
68.8 g
Other:
0.28 g
Contains
more
Protein Protein
+684.5%
Contains
more
Fats Fats
+11188.6%
Contains
more
Other Other
+1492.9%
Contains
more
Carbs Carbs
+20.3%
Contains
more
Water Water
+1367%
Fat Type Comparison
Fat type breakdown side-by-side comparison
2
15%
40%
46%
Saturated fat:
Sat. Fat
6.957 g
Monounsaturated fat:
Mono. Fat
18.759 g
Polyunsaturated fat:
Poly. Fat
21.773 g
1
26%
16%
59%
Saturated fat:
Sat. Fat
0.093 g
Monounsaturated fat:
Mono. Fat
0.057 g
Polyunsaturated fat:
Poly. Fat
0.214 g
Contains
more
Mono. Fat Monounsaturated fat
+32810.5%
Contains
more
Poly. Fat Polyunsaturated fat
+10074.3%
Contains
less
Sat. Fat Saturated fat
-98.7%