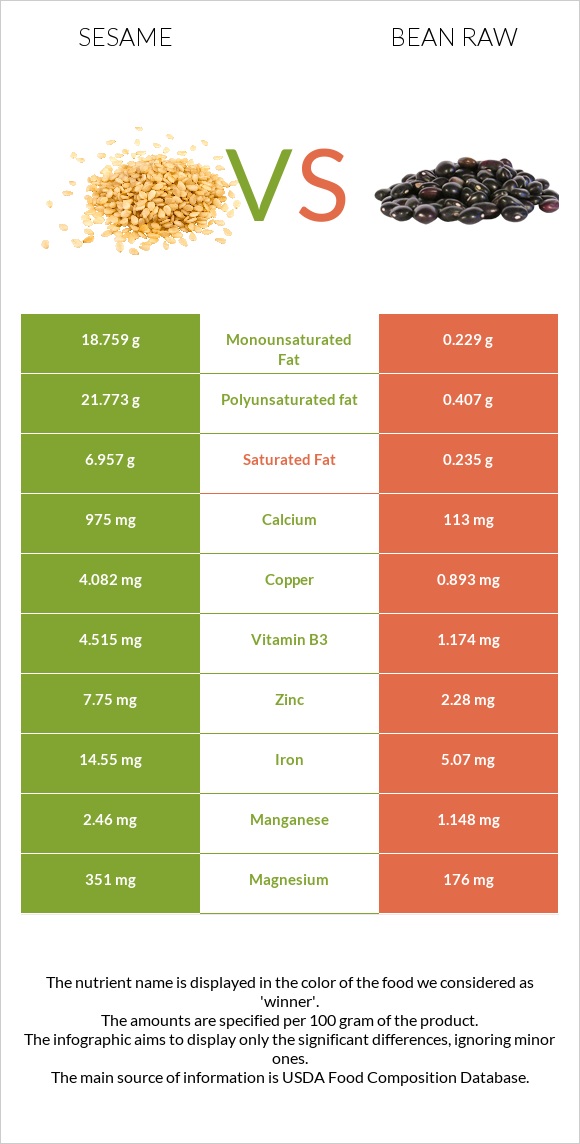
A recap on the differences between sesame and bean raw Sesame has more copper, iron, calcium, manganese, zinc, magnesium, and phosphorus; however, bean raw is higher in folate and potassium. Sesame covers your daily copper needs 354% more than bean raw. Bean raw contains 30 times less saturated fat than sesame. Sesame contains 6.957g of saturated fat, while bean raw contains 0.235g. Food varieties used in this article are Seeds, sesame seeds, whole, dried and Beans, pinto, mature seeds, raw .
Infographic
Mineral Comparison
Mineral comparison score is based on the number of minerals by which one or the other food is richer. The "coverage" charts below show how much of the daily needs can be covered by 300 grams of the food.
8
100 g
300 g
1 tbsp - 9g 1 cup - 144g
Magnesium
Magnesium
Calcium
Calcium
Potassium
Potassium
Iron
Iron
Copper
Copper
Zinc
Zinc
Phosphorus
Phosphorus
Sodium
Sodium
Manganese
Manganese
Selenium
Selenium
251%
293%
41%
546%
1361%
211%
270%
1.4%
321%
188%
1
100 g
300 g
1 tbsp - 12g 1 cup - 193g
Magnesium
Magnesium
Calcium
Calcium
Potassium
Potassium
Iron
Iron
Copper
Copper
Zinc
Zinc
Phosphorus
Phosphorus
Sodium
Sodium
Manganese
Manganese
Selenium
Selenium
126%
34%
123%
190%
298%
62%
176%
1.6%
150%
152%
Vitamin Comparison
Vitamin comparison score is based on the number of vitamins by which one or the other food is richer. The "coverage" charts below show how much of the daily needs can be covered by 300 grams of the food.
4
100 g
300 g
1 tbsp - 9g 1 cup - 144g
Vitamin C
Vit. C
Vitamin D
Vit. D
Vitamin A
Vit. A
Vitamin E
Vit. E
Vitamin B1
Vit. B1
Vitamin B2
Vit. B2
Vitamin B3
Vit. B3
Vitamin B5
Vit. B5
Vitamin B6
Vit. B6
Vitamin B12
Vit. B12
Vitamin K
Vit. K
Folate
Folate
0%
0%
0%
5%
198%
57%
85%
3%
182%
0%
0%
73%
4
100 g
300 g
1 tbsp - 12g 1 cup - 193g
Vitamin C
Vit. C
Vitamin D
Vit. D
Vitamin A
Vit. A
Vitamin E
Vit. E
Vitamin B1
Vit. B1
Vitamin B2
Vit. B2
Vitamin B3
Vit. B3
Vitamin B5
Vit. B5
Vitamin B6
Vit. B6
Vitamin B12
Vit. B12
Vitamin K
Vit. K
Folate
Folate
21%
0%
0%
4.2%
178%
49%
22%
47%
109%
0%
14%
394%
All nutrients comparison - raw data values
Nutrient
DV% diff.
Copper
4.082mg
0.893mg
354%
Polyunsaturated fat
21.773g
0.407g
142%
Iron
14.55mg
5.07mg
119%
Folate
97µg
525µg
107%
Calcium
975mg
113mg
86%
Fats
49.67g
1.23g
75%
Manganese
2.46mg
1.148mg
57%
Zinc
7.75mg
2.28mg
50%
Monounsaturated fat
18.759g
0.229g
46%
Magnesium
351mg
176mg
42%
Phosphorus
629mg
411mg
31%
Saturated fat
6.957g
0.235g
31%
Potassium
468mg
1393mg
27%
Vitamin B6
0.79mg
0.474mg
24%
Vitamin B3
4.515mg
1.174mg
21%
Fiber
11.8g
15.5g
15%
Vitamin B5
0.05mg
0.785mg
15%
Starch
34.17g
14%
Carbs
23.45g
62.55g
13%
Selenium
34.4µg
27.9µg
12%
Calories
573kcal
347kcal
11%
Protein
17.73g
21.42g
7%
Vitamin C
0mg
6.3mg
7%
Vitamin B1
0.791mg
0.713mg
7%
Choline
25.6mg
66.2mg
7%
Vitamin K
0µg
5.6µg
5%
Vitamin B2
0.247mg
0.212mg
3%
Protein per 100 calories
3.1g
6.2g
N/A
Calories per 10 g protein
323kcal
162kcal
N/A
Weight per 100 calories
17g
29g
N/A
Unsaturated / Saturated Fat ratio
5.8
2.7
N/A
Net carbs
11.65g
47.05g
N/A
Sugar
0.3g
2.11g
N/A
Sodium
11mg
12mg
0%
Vitamin E
0.25mg
0.21mg
0%
Tryptophan
0.388mg
0.237mg
0%
Threonine
0.736mg
0.81mg
0%
Isoleucine
0.763mg
0.871mg
0%
Leucine
1.358mg
1.558mg
0%
Lysine
0.569mg
1.356mg
0%
Methionine
0.586mg
0.259mg
0%
Phenylalanine
0.94mg
1.095mg
0%
Valine
0.99mg
0.998mg
0%
Histidine
0.522mg
0.556mg
0%
Macronutrient Comparison
Macronutrient breakdown side-by-side comparison
2
18%
50%
23%
5%
4%
Protein:
17.73 g
Fats:
49.67 g
Carbs:
23.45 g
Water:
4.69 g
Other:
4.46 g
3
21%
63%
11%
3%
Protein:
21.42 g
Fats:
1.23 g
Carbs:
62.55 g
Water:
11.33 g
Other:
3.47 g
Contains
more
Fats Fats
+3938.2%
Contains
more
Other Other
+28.5%
Contains
more
Protein Protein
+20.8%
Contains
more
Carbs Carbs
+166.7%
Contains
more
Water Water
+141.6%
Fat Type Comparison
Fat type breakdown side-by-side comparison
2
15%
40%
46%
Saturated fat:
Sat. Fat
6.957 g
Monounsaturated fat:
Mono. Fat
18.759 g
Polyunsaturated fat:
Poly. Fat
21.773 g
1
27%
26%
47%
Saturated fat:
Sat. Fat
0.235 g
Monounsaturated fat:
Mono. Fat
0.229 g
Polyunsaturated fat:
Poly. Fat
0.407 g
Contains
more
Mono. Fat Monounsaturated fat
+8091.7%
Contains
more
Poly. Fat Polyunsaturated fat
+5249.6%
Contains
less
Sat. Fat Saturated fat
-96.6%