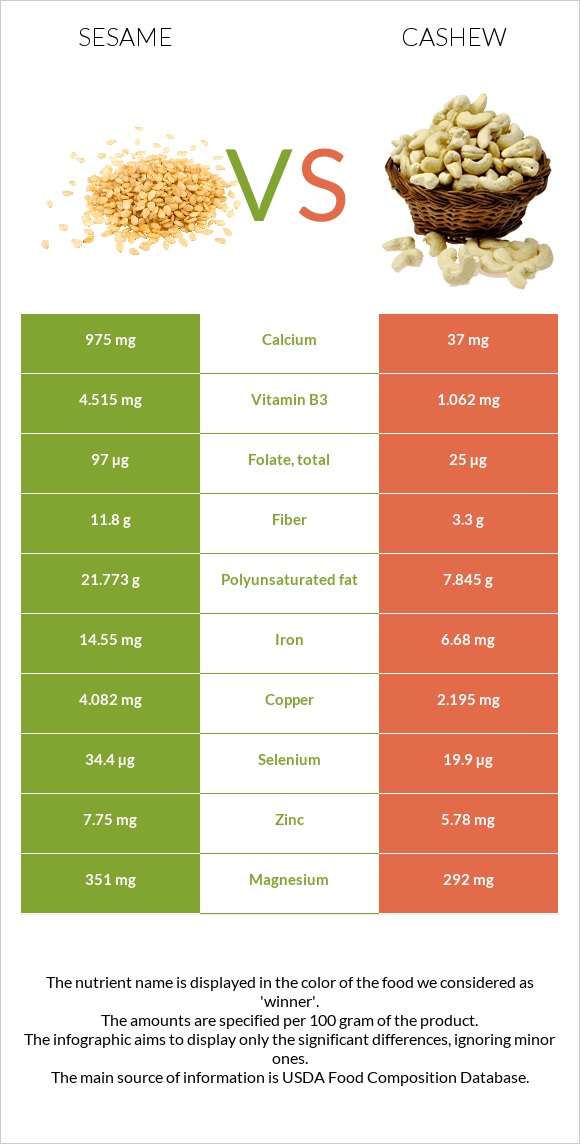
Significant differences between sesame and cashew Sesame has more copper, iron, calcium, manganese, fiber, vitamin B1, vitamin B6, selenium, and vitamin B3; however, cashew is richer in vitamin K. Sesame covers your daily copper needs 210% more than cashew. Cashew has 26 times less calcium than sesame. Sesame has 975mg of calcium, while cashew has 37mg. Specific food types used in this comparison are Seeds, sesame seeds, whole, dried and Nuts, cashew nuts, raw .
Infographic
Mineral Comparison
Mineral comparison score is based on the number of minerals by which one or the other food is richer. The "coverage" charts below show how much of the daily needs can be covered by 300 grams of the food.
7
100 g
300 g
1 tbsp - 9g 1 cup - 144g
Magnesium
Magnesium
Calcium
Calcium
Potassium
Potassium
Iron
Iron
Copper
Copper
Zinc
Zinc
Phosphorus
Phosphorus
Sodium
Sodium
Manganese
Manganese
Selenium
Selenium
251%
293%
41%
546%
1361%
211%
270%
1.4%
321%
188%
1
100 g
300 g
1 oz - 28.35g
Magnesium
Magnesium
Calcium
Calcium
Potassium
Potassium
Iron
Iron
Copper
Copper
Zinc
Zinc
Phosphorus
Phosphorus
Sodium
Sodium
Manganese
Manganese
Selenium
Selenium
209%
11%
58%
251%
732%
158%
254%
1.6%
216%
109%
Vitamin Comparison
Vitamin comparison score is based on the number of vitamins by which one or the other food is richer. The "coverage" charts below show how much of the daily needs can be covered by 300 grams of the food.
5
100 g
300 g
1 tbsp - 9g 1 cup - 144g
Vitamin C
Vit. C
Vitamin D
Vit. D
Vitamin A
Vit. A
Vitamin E
Vit. E
Vitamin B1
Vit. B1
Vitamin B2
Vit. B2
Vitamin B3
Vit. B3
Vitamin B5
Vit. B5
Vitamin B6
Vit. B6
Vitamin B12
Vit. B12
Vitamin K
Vit. K
Folate
Folate
0%
0%
0%
5%
198%
57%
85%
3%
182%
0%
0%
73%
4
100 g
300 g
1 oz - 28.35g
Vitamin C
Vit. C
Vitamin D
Vit. D
Vitamin A
Vit. A
Vitamin E
Vit. E
Vitamin B1
Vit. B1
Vitamin B2
Vit. B2
Vitamin B3
Vit. B3
Vitamin B5
Vit. B5
Vitamin B6
Vit. B6
Vitamin B12
Vit. B12
Vitamin K
Vit. K
Folate
Folate
1.7%
0%
0%
18%
106%
13%
20%
52%
96%
0%
85%
19%
All nutrients comparison - raw data values
Nutrient
DV% diff.
Copper
4.082mg
2.195mg
210%
Iron
14.55mg
6.68mg
98%
Calcium
975mg
37mg
94%
Polyunsaturated fat
21.773g
7.845g
93%
Manganese
2.46mg
1.655mg
35%
Fiber
11.8g
3.3g
34%
Vitamin B1
0.791mg
0.423mg
31%
Vitamin B6
0.79mg
0.417mg
29%
Vitamin K
0µg
34.1µg
28%
Selenium
34.4µg
19.9µg
26%
Vitamin B3
4.515mg
1.062mg
22%
Zinc
7.75mg
5.78mg
18%
Folate
97µg
25µg
18%
Vitamin B5
0.05mg
0.864mg
16%
Vitamin B2
0.247mg
0.058mg
15%
Magnesium
351mg
292mg
14%
Monounsaturated fat
18.759g
23.797g
13%
Starch
23.49g
10%
Fats
49.67g
43.85g
9%
Potassium
468mg
660mg
6%
Phosphorus
629mg
593mg
5%
Choline
25.6mg
5%
Vitamin E
0.25mg
0.9mg
4%
Saturated fat
6.957g
7.783g
4%
Carbs
23.45g
30.19g
2%
Calories
573kcal
553kcal
1%
Protein
17.73g
18.22g
1%
Vitamin C
0mg
0.5mg
1%
Protein per 100 calories
3.1g
3.3g
N/A
Calories per 10 g protein
323kcal
304kcal
N/A
Weight per 100 calories
17g
18g
N/A
Unsaturated / Saturated Fat ratio
5.8
4.1
N/A
Net carbs
11.65g
26.89g
N/A
Sugar
0.3g
5.91g
N/A
Sodium
11mg
12mg
0%
Tryptophan
0.388mg
0.287mg
0%
Threonine
0.736mg
0.688mg
0%
Isoleucine
0.763mg
0.789mg
0%
Leucine
1.358mg
1.472mg
0%
Lysine
0.569mg
0.928mg
0%
Methionine
0.586mg
0.362mg
0%
Phenylalanine
0.94mg
0.951mg
0%
Valine
0.99mg
1.094mg
0%
Histidine
0.522mg
0.456mg
0%
Fructose
0.05g
0%
Macronutrient Comparison
Macronutrient breakdown side-by-side comparison
2
18%
50%
23%
5%
4%
Protein:
17.73 g
Fats:
49.67 g
Carbs:
23.45 g
Water:
4.69 g
Other:
4.46 g
3
18%
44%
30%
5%
3%
Protein:
18.22 g
Fats:
43.85 g
Carbs:
30.19 g
Water:
5.2 g
Other:
2.54 g
Contains
more
Fats Fats
+13.3%
Contains
more
Other Other
+75.6%
Contains
more
Carbs Carbs
+28.7%
Contains
more
Water Water
+10.9%
~equal in
Protein
~18.22g
Fat Type Comparison
Fat type breakdown side-by-side comparison
2
15%
40%
46%
Saturated fat:
Sat. Fat
6.957 g
Monounsaturated fat:
Mono. Fat
18.759 g
Polyunsaturated fat:
Poly. Fat
21.773 g
1
20%
60%
20%
Saturated fat:
Sat. Fat
7.783 g
Monounsaturated fat:
Mono. Fat
23.797 g
Polyunsaturated fat:
Poly. Fat
7.845 g
Contains
less
Sat. Fat Saturated fat
-10.6%
Contains
more
Poly. Fat Polyunsaturated fat
+177.5%
Contains
more
Mono. Fat Monounsaturated fat
+26.9%