Seeds, sesame seeds, whole, roasted and toasted vs. Sesame — In-Depth Nutrition Comparison
Compare
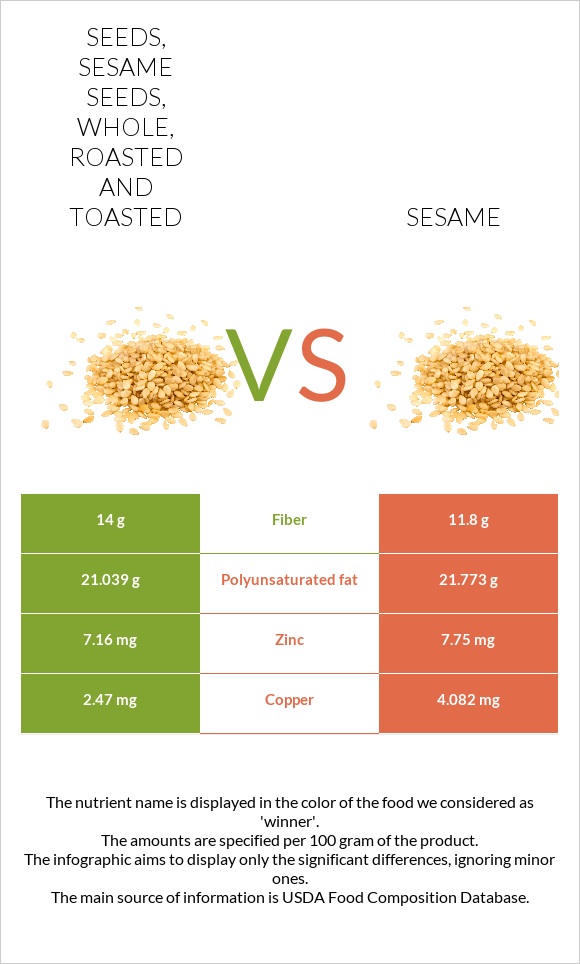
What are the differences between seeds, sesame seeds, whole, roasted and toasted and sesame?
- Seeds, sesame seeds, whole, roasted, and toasted is higher in fiber, yet sesame is higher in copper, zinc, and polyunsaturated fat.
- Sesame's daily need coverage for copper is 179% more.
We used Seeds, sesame seeds, whole, roasted, and toasted and Seeds, sesame seeds, whole, dried types in this article.
Infographic
Infographic link
Mineral Comparison
Mineral comparison score is based on the number of minerals by which one or the other food is richer. The "coverage" charts below show how much of the daily needs can be covered by 300 grams of the food.
| Contains more CopperCopper | +65.3% |
Vitamin Comparison
Vitamin comparison score is based on the number of vitamins by which one or the other food is richer. The "coverage" charts below show how much of the daily needs can be covered by 300 grams of the food.
All nutrients comparison - raw data values
| Nutrient |  |
|
DV% diff. |
| Copper | 2.47mg | 4.082mg | 179% |
| Fiber | 14g | 11.8g | 9% |
| Zinc | 7.16mg | 7.75mg | 5% |
| Polyunsaturated fat | 21.039g | 21.773g | 5% |
| Choline | 25.6mg | 5% | |
| Fats | 48g | 49.67g | 3% |
| Iron | 14.76mg | 14.55mg | 3% |
| Manganese | 2.496mg | 2.46mg | 2% |
| Vitamin E | 0.25mg | 2% | |
| Monounsaturated fat | 18.127g | 18.759g | 2% |
| Protein | 16.96g | 17.73g | 2% |
| Vitamin B1 | 0.803mg | 0.791mg | 1% |
| Saturated fat | 6.722g | 6.957g | 1% |
| Phosphorus | 638mg | 629mg | 1% |
| Calcium | 989mg | 975mg | 1% |
| Magnesium | 356mg | 351mg | 1% |
| Carbs | 25.74g | 23.45g | 1% |
| Vitamin B6 | 0.802mg | 0.79mg | 1% |
| Calories | 565kcal | 573kcal | 0% |
| Net carbs | 11.74g | 11.65g | N/A |
| Potassium | 475mg | 468mg | 0% |
| Sugar | 0.3g | N/A | |
| Sodium | 11mg | 11mg | 0% |
| Selenium | 34.4µg | 34.4µg | 0% |
| Vitamin B2 | 0.251mg | 0.247mg | 0% |
| Vitamin B3 | 4.581mg | 4.515mg | 0% |
| Vitamin B5 | 0.051mg | 0.05mg | 0% |
| Folate | 98µg | 97µg | 0% |
| Tryptophan | 0.371mg | 0.388mg | 0% |
| Threonine | 0.704mg | 0.736mg | 0% |
| Isoleucine | 0.73mg | 0.763mg | 0% |
| Leucine | 1.299mg | 1.358mg | 0% |
| Lysine | 0.544mg | 0.569mg | 0% |
| Methionine | 0.56mg | 0.586mg | 0% |
| Phenylalanine | 0.899mg | 0.94mg | 0% |
| Valine | 0.947mg | 0.99mg | 0% |
| Histidine | 0.499mg | 0.522mg | 0% |
Macronutrient Comparison
Macronutrient breakdown side-by-side comparison
Protein:
16.96 g
Fats:
48 g
Carbs:
25.74 g
Water:
3.3 g
Other:
6 g
Protein:
17.73 g
Fats:
49.67 g
Carbs:
23.45 g
Water:
4.69 g
Other:
4.46 g
| Contains more OtherOther | +34.5% |
| Contains more WaterWater | +42.1% |
~equal in
Protein
~17.73g
~equal in
Fats
~49.67g
~equal in
Carbs
~23.45g
Fat Type Comparison
Fat type breakdown side-by-side comparison
Saturated fat:
Sat. Fat
6.722 g
Monounsaturated fat:
Mono. Fat
18.127 g
Polyunsaturated fat:
Poly. Fat
21.039 g
Saturated fat:
Sat. Fat
6.957 g
Monounsaturated fat:
Mono. Fat
18.759 g
Polyunsaturated fat:
Poly. Fat
21.773 g
~equal in
Saturated fat
~6.957g
~equal in
Monounsaturated fat
~18.759g
~equal in
Polyunsaturated fat
~21.773g