Snacks, corn-based, extruded, puffs or twists, cheese-flavor vs. Snacks, corn-based, extruded, puffs or twists, cheese-flavor, unenriched — In-Depth Nutrition Comparison
Compare
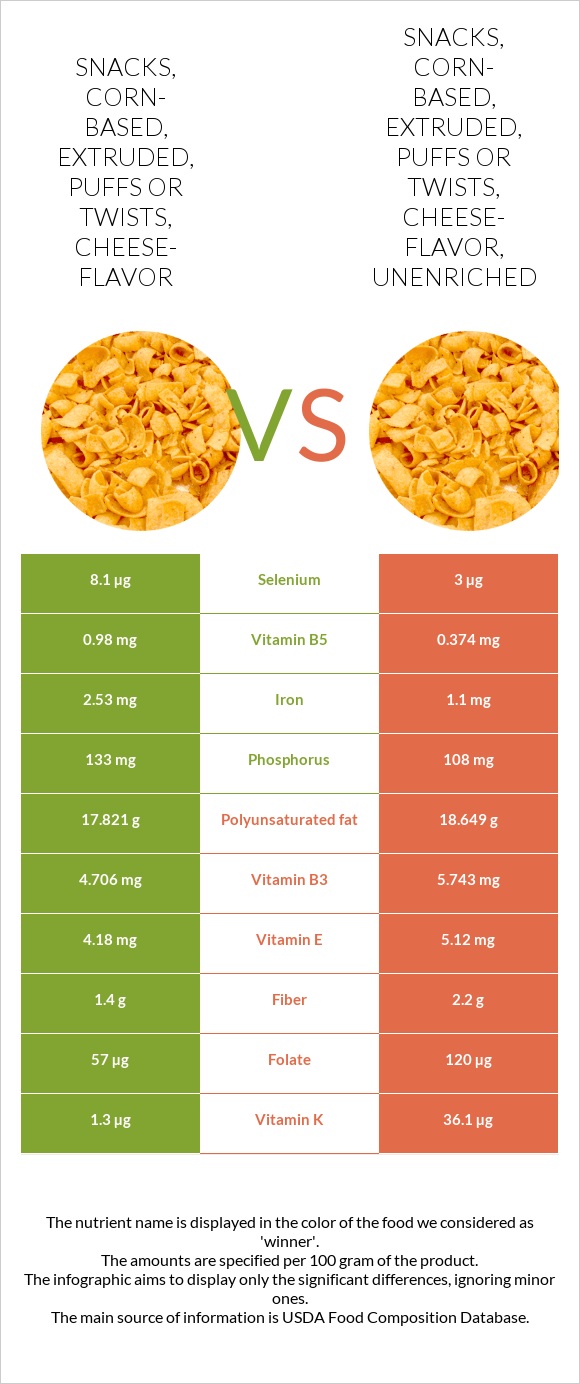
Significant differences between snacks, corn-based, extruded, puffs or twists, cheese-flavor and snacks, corn-based, extruded, puffs or twists, cheese-flavor, unenriched
- Snacks, corn-based, extruded, puffs or twists, cheese-flavor has more iron, vitamin B5, and selenium; however, snacks, corn-based, extruded, puffs or twists, cheese-flavor, unenriched is richer in vitamin K, folate, vitamin B3, vitamin E, and polyunsaturated fat.
- Snacks, corn-based, extruded, puffs or twists, cheese-flavor, unenriched covers your daily vitamin K needs 29% more than snacks, corn-based, extruded, puffs or twists, cheese-flavor.
- Snacks, corn-based, extruded, puffs or twists, cheese-flavor, unenriched has 3 times less selenium than snacks, corn-based, extruded, puffs or twists, cheese-flavor. Snacks, corn-based, extruded, puffs or twists, cheese-flavor has 8.1µg of selenium, while snacks, corn-based, extruded, puffs or twists, cheese-flavor, unenriched has 3µg.
Specific food types used in this comparison are Snacks, corn-based, extruded, puffs or twists, cheese-flavor and Snacks, corn-based, extruded, puffs or twists, cheese-flavor, unenriched.
Infographic
Infographic link
Mineral Comparison
Mineral comparison score is based on the number of minerals by which one or the other food is richer. The "coverage" charts below show how much of the daily needs can be covered by 300 grams of the food.
| Contains more IronIron | +130% |
| Contains more PhosphorusPhosphorus | +23.1% |
| Contains more SeleniumSelenium | +170% |
| Contains more MagnesiumMagnesium | +17.6% |
| Contains more CopperCopper | +96.9% |
| Contains more ZincZinc | +50% |
| Contains more ManganeseManganese | +63.8% |
Vitamin Comparison
Vitamin comparison score is based on the number of vitamins by which one or the other food is richer. The "coverage" charts below show how much of the daily needs can be covered by 300 grams of the food.
| Contains more Vitamin DVitamin D | +∞% |
| Contains more Vitamin B5Vitamin B5 | +162% |
| Contains more Vitamin B6Vitamin B6 | +23.4% |
| Contains more Vitamin EVitamin E | +22.5% |
| Contains more Vitamin B2Vitamin B2 | +25.8% |
| Contains more Vitamin B3Vitamin B3 | +22% |
| Contains more Vitamin KVitamin K | +2676.9% |
| Contains more FolateFolate | +110.5% |
All nutrients comparison - raw data values
| Nutrient |  |
|
DV% diff. |
| Vitamin K | 1.3µg | 36.1µg | 29% |
| Starch | 46.8g | 19% | |
| Iron | 2.53mg | 1.1mg | 18% |
| Folate | 57µg | 120µg | 16% |
| Vitamin B5 | 0.98mg | 0.374mg | 12% |
| Selenium | 8.1µg | 3µg | 9% |
| Vitamin E | 4.18mg | 5.12mg | 6% |
| Vitamin B3 | 4.706mg | 5.743mg | 6% |
| Polyunsaturated fat | 17.821g | 18.649g | 6% |
| Phosphorus | 133mg | 108mg | 4% |
| Fiber | 1.4g | 2.2g | 3% |
| Copper | 0.032mg | 0.063mg | 3% |
| Vitamin B2 | 0.159mg | 0.2mg | 3% |
| Zinc | 0.4mg | 0.6mg | 2% |
| Sodium | 942mg | 896mg | 2% |
| Manganese | 0.058mg | 0.095mg | 2% |
| Choline | 11.6mg | 2% | |
| Cholesterol | 7mg | 4mg | 1% |
| Vitamin D | 0.1µg | 0µg | 1% |
| Magnesium | 17mg | 20mg | 1% |
| Vitamin B6 | 0.079mg | 0.064mg | 1% |
| Saturated fat | 5.36g | 5.512g | 1% |
| Monounsaturated fat | 10.052g | 10.437g | 1% |
| Calories | 560kcal | 558kcal | 0% |
| Protein | 5.85g | 5.76g | 0% |
| Protein per 100 calories | 1g | 1g | N/A |
| Calories per 10 g protein | 957kcal | 969kcal | N/A |
| Weight per 100 calories | 18g | 18g | N/A |
| Fats | 36.01g | 35.76g | 0% |
| Unsaturated / Saturated Fat ratio | 5.2 | 5.3 | N/A |
| Net carbs | 52.13g | 51.9g | N/A |
| Carbs | 53.53g | 54.1g | 0% |
| Vitamin D* | 2 IU | 0 IU | 0% |
| Calcium | 56mg | 58mg | 0% |
| Potassium | 182mg | 197mg | 0% |
| Sugar | 3.19g | 2.76g | N/A |
| Vitamin B1 | 0.16mg | 0.155mg | 0% |
| Vitamin B12 | 0.48µg | 0.48µg | 0% |
| Trans fat | 0.574g | 0.806g | N/A |
| Tryptophan | 0.072mg | 0.094mg | 0% |
| Threonine | 0.223mg | 0.391mg | 0% |
| Isoleucine | 0.369mg | 0.366mg | 0% |
| Leucine | 0.777mg | 0.783mg | 0% |
| Lysine | 0.424mg | 0.456mg | 0% |
| Methionine | 0.176mg | 0.151mg | 0% |
| Phenylalanine | 0.366mg | 0.299mg | 0% |
| Valine | 0.423mg | 0.404mg | 0% |
| Histidine | 0.221mg | 0.181mg | 0% |
| Omega-3 - ALA | 0.312g | 0.3g | N/A |
| Omega-6 - Gamma-linoleic acid | 0.01g | 0g | N/A |
| Omega-6 - Dihomo-gamma-linoleic acid | 0.002g | N/A | |
| Omega-6 - Eicosadienoic acid | 0.008g | 0g | N/A |
| Omega-6 - Linoleic acid | 17.143g | N/A |
Macronutrient Comparison
Macronutrient breakdown side-by-side comparison
Protein:
5.85 g
Fats:
36.01 g
Carbs:
53.53 g
Water:
1.57 g
Other:
3.04 g
Protein:
5.76 g
Fats:
35.76 g
Carbs:
54.1 g
Water:
1.5 g
Other:
2.88 g
~equal in
Protein
~5.76g
~equal in
Fats
~35.76g
~equal in
Carbs
~54.1g
~equal in
Water
~1.5g
~equal in
Other
~2.88g
Fat Type Comparison
Fat type breakdown side-by-side comparison
Saturated fat:
Sat. Fat
5.36 g
Monounsaturated fat:
Mono. Fat
10.052 g
Polyunsaturated fat:
Poly. Fat
17.821 g
Saturated fat:
Sat. Fat
5.512 g
Monounsaturated fat:
Mono. Fat
10.437 g
Polyunsaturated fat:
Poly. Fat
18.649 g
~equal in
Saturated fat
~5.512g
~equal in
Monounsaturated fat
~10.437g
~equal in
Polyunsaturated fat
~18.649g
Carbohydrate type comparison
Carbohydrate type breakdown side-by-side comparison
Starch:
46.8 g
Sucrose:
0 g
Glucose:
0 g
Fructose:
0 g
Lactose:
3.19 g
Maltose:
0 g
Galactose:
0 g
Starch:
0 g
Sucrose:
0 g
Glucose:
0.15 g
Fructose:
0 g
Lactose:
2.12 g
Maltose:
0 g
Galactose:
0.07 g
| Contains more StarchStarch | +∞% |
| Contains more LactoseLactose | +50.5% |
| Contains more GlucoseGlucose | +∞% |
| Contains more GalactoseGalactose | +∞% |
~equal in
Sucrose
~0g
~equal in
Fructose
~0g
~equal in
Maltose
~0g