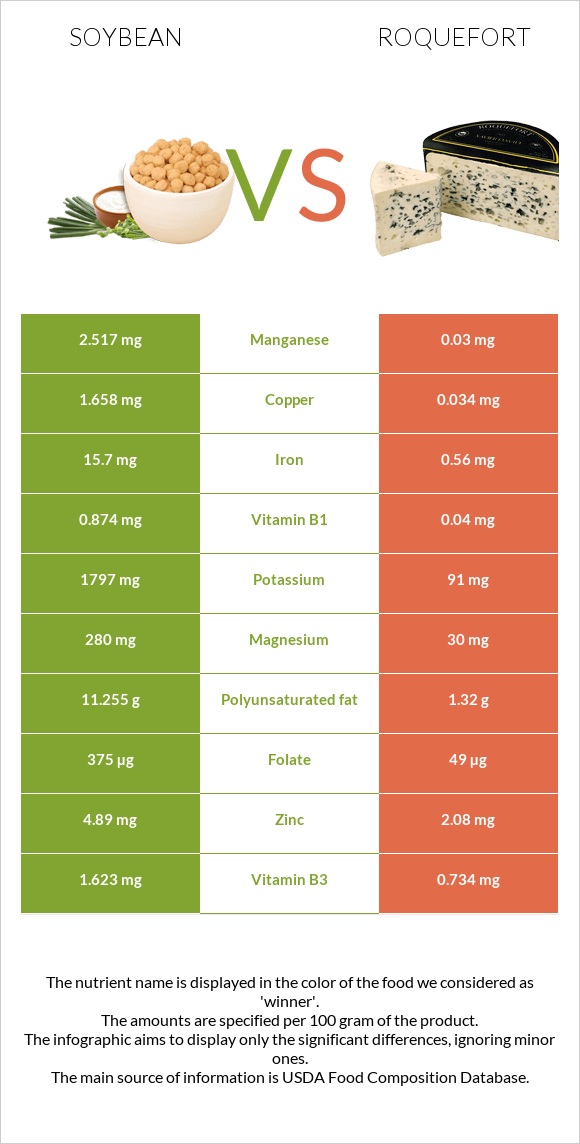
How are soybeans and roquefort different? Soybeans have more iron, copper, manganese, and fiber; however, roquefort is richer in calcium, vitamin B5, and vitamin B12. Roquefort covers your daily need for saturated fat, 90% more than soybeans. Soybeans contain less saturated fat. Roquefort has a higher glycemic index. The glycemic index of roquefort is 27, while the glycemic index of soybeans is 14. Soybeans, mature cooked, boiled, without salt and Cheese, roquefort types were used in this article.
Infographic
Mineral Comparison
Mineral comparison score is based on the number of minerals by which one or the other food is richer. The "coverage" charts below show how much of the daily needs can be covered by 300 grams of the food.
6
100 g
300 g
1 tbsp - 10.7g 1 cup - 172g
Magnesium
Magnesium
Calcium
Calcium
Potassium
Potassium
Iron
Iron
Copper
Copper
Zinc
Zinc
Phosphorus
Phosphorus
Sodium
Sodium
Manganese
Manganese
Selenium
Selenium
61%
31%
45%
193%
136%
31%
105%
0.13%
107%
40%
4
100 g
300 g
1 oz - 28.35g 1 package (3 oz) - 85g
Magnesium
Magnesium
Calcium
Calcium
Potassium
Potassium
Iron
Iron
Copper
Copper
Zinc
Zinc
Phosphorus
Phosphorus
Sodium
Sodium
Manganese
Manganese
Selenium
Selenium
21%
199%
8%
21%
11%
57%
168%
236%
3.9%
79%
Vitamin Comparison
Vitamin comparison score is based on the number of vitamins by which one or the other food is richer. The "coverage" charts below show how much of the daily needs can be covered by 300 grams of the food.
5
100 g
300 g
1 tbsp - 10.7g 1 cup - 172g
Vitamin C
Vit. C
Vitamin D
Vit. D
Vitamin A
Vit. A
Vitamin E
Vit. E
Vitamin B1
Vit. B1
Vitamin B2
Vit. B2
Vitamin B3
Vit. B3
Vitamin B5
Vit. B5
Vitamin B6
Vit. B6
Vitamin B12
Vit. B12
Vitamin K
Vit. K
Folate
Folate
5.7%
0%
0%
7%
39%
66%
7.5%
11%
54%
0%
48%
41%
5
100 g
300 g
1 oz - 28.35g 1 package (3 oz) - 85g
Vitamin C
Vit. C
Vitamin D
Vit. D
Vitamin A
Vit. A
Vitamin E
Vit. E
Vitamin B1
Vit. B1
Vitamin B2
Vit. B2
Vitamin B3
Vit. B3
Vitamin B5
Vit. B5
Vitamin B6
Vit. B6
Vitamin B12
Vit. B12
Vitamin K
Vit. K
Folate
Folate
0%
0%
98%
0%
10%
135%
14%
104%
29%
80%
0%
37%
All nutrients comparison - raw data values
Nutrient
DV% diff.
Saturated fat
1.297g
19.263g
82%
Sodium
1mg
1809mg
79%
Iron
5.14mg
0.56mg
57%
Calcium
102mg
662mg
56%
Copper
0.407mg
0.034mg
41%
Manganese
0.824mg
0.03mg
35%
Fats
8.97g
30.64g
33%
Vitamin A
0µg
294µg
33%
Vitamin B5
0.179mg
1.731mg
31%
Cholesterol
0mg
90mg
30%
Vitamin B12
0µg
0.64µg
27%
Polyunsaturated fat
5.064g
1.32g
25%
Fiber
6g
0g
24%
Vitamin B2
0.285mg
0.586mg
23%
Phosphorus
245mg
392mg
21%
Vitamin K
19.2µg
16%
Monounsaturated fat
1.981g
8.474g
16%
Magnesium
86mg
30mg
13%
Selenium
7.3µg
14.5µg
13%
Potassium
515mg
91mg
12%
Calories
172kcal
369kcal
10%
Vitamin B1
0.155mg
0.04mg
10%
Choline
47.5mg
9%
Zinc
1.15mg
2.08mg
8%
Vitamin B6
0.234mg
0.124mg
8%
Protein
18.21g
21.54g
7%
Vitamin C
1.7mg
0mg
2%
Carbs
8.36g
2g
2%
Vitamin E
0.35mg
2%
Vitamin B3
0.399mg
0.734mg
2%
Folate
54µg
49µg
1%
Protein per 100 calories
11g
5.8g
N/A
Calories per 10 g protein
94kcal
171kcal
N/A
Weight per 100 calories
58g
27g
N/A
Unsaturated / Saturated Fat ratio
5.4
0.51
N/A
Net carbs
2.36g
2g
N/A
Sugar
3g
N/A
Tryptophan
0.242mg
0.303mg
0%
Threonine
0.723mg
0.965mg
0%
Isoleucine
0.807mg
1.217mg
0%
Leucine
1.355mg
2.114mg
0%
Lysine
1.108mg
1.848mg
0%
Methionine
0.224mg
0.558mg
0%
Phenylalanine
0.869mg
1.023mg
0%
Valine
0.831mg
1.614mg
0%
Histidine
0.449mg
0.602mg
0%
Macronutrient Comparison
Macronutrient breakdown side-by-side comparison
2
18%
9%
8%
63%
2%
Protein:
18.21 g
Fats:
8.97 g
Carbs:
8.36 g
Water:
62.55 g
Other:
1.91 g
3
22%
31%
2%
39%
6%
Protein:
21.54 g
Fats:
30.64 g
Carbs:
2 g
Water:
39.38 g
Other:
6.44 g
Contains
more
Carbs Carbs
+318%
Contains
more
Water Water
+58.8%
Contains
more
Protein Protein
+18.3%
Contains
more
Fats Fats
+241.6%
Contains
more
Other Other
+237.2%
Fat Type Comparison
Fat type breakdown side-by-side comparison
2
16%
24%
61%
Saturated fat:
Sat. Fat
1.297 g
Monounsaturated fat:
Mono. Fat
1.981 g
Polyunsaturated fat:
Poly. Fat
5.064 g
1
66%
29%
5%
Saturated fat:
Sat. Fat
19.263 g
Monounsaturated fat:
Mono. Fat
8.474 g
Polyunsaturated fat:
Poly. Fat
1.32 g
Contains
less
Sat. Fat Saturated fat
-93.3%
Contains
more
Poly. Fat Polyunsaturated fat
+283.6%
Contains
more
Mono. Fat Monounsaturated fat
+327.8%