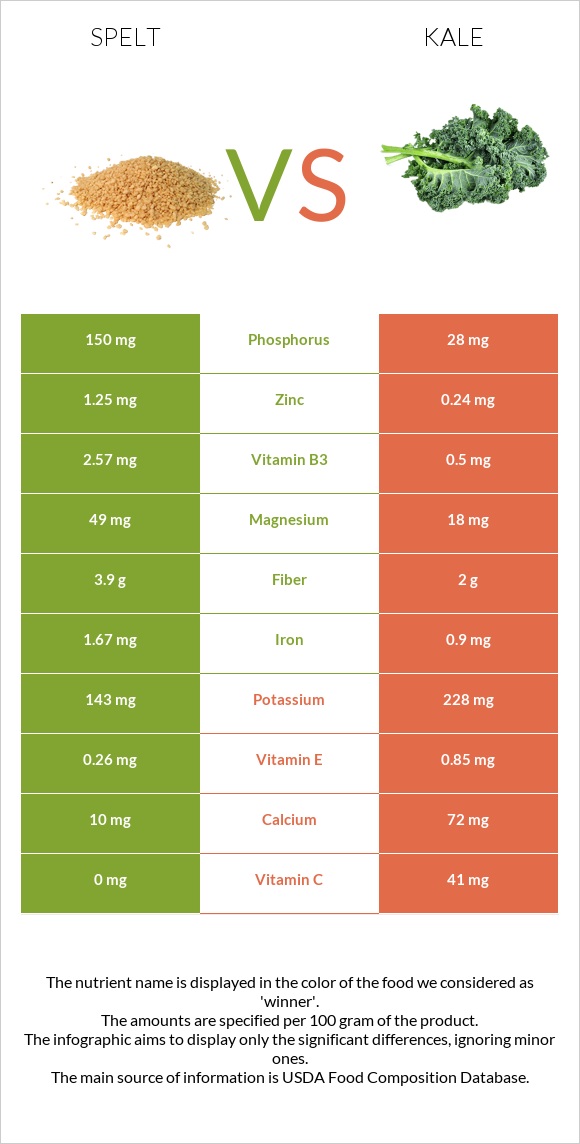
A recap on the differences between spelt and kale Spelt has more manganese, phosphorus, vitamin B3, iron, zinc, fiber, magnesium, and copper; however, kale is higher in vitamin A and vitamin C. Kale covers your daily vitamin A needs 272% more than spelt. Kale contains 5 times less phosphorus than spelt. Spelt contains 150mg of phosphorus, while kale contains 28mg. Food varieties used in this article are Spelt, cooked and Kale, cooked, boiled, drained, without salt .
Infographic
Mineral Comparison
Mineral comparison score is based on the number of minerals by which one or the other food is richer. The "coverage" charts below show how much of the daily needs can be covered by 300 grams of the food.
8
100 g
300 g
1 cup - 194g
Magnesium
Magnesium
Calcium
Calcium
Potassium
Potassium
Iron
Iron
Copper
Copper
Zinc
Zinc
Phosphorus
Phosphorus
Sodium
Sodium
Manganese
Manganese
Selenium
Selenium
35%
3%
13%
63%
72%
34%
64%
0.65%
142%
22%
2
100 g
300 g
1 cup, chopped - 130g
Magnesium
Magnesium
Calcium
Calcium
Potassium
Potassium
Iron
Iron
Copper
Copper
Zinc
Zinc
Phosphorus
Phosphorus
Sodium
Sodium
Manganese
Manganese
Selenium
Selenium
13%
22%
20%
34%
52%
6.5%
12%
3%
54%
4.9%
Vitamin Comparison
Vitamin comparison score is based on the number of vitamins by which one or the other food is richer. The "coverage" charts below show how much of the daily needs can be covered by 300 grams of the food.
2
100 g
300 g
1 cup - 194g
Vitamin C
Vit. C
Vitamin D
Vit. D
Vitamin A
Vit. A
Vitamin E
Vit. E
Vitamin B1
Vit. B1
Vitamin B2
Vit. B2
Vitamin B3
Vit. B3
Vitamin B5
Vit. B5
Vitamin B6
Vit. B6
Vitamin B12
Vit. B12
Vitamin K
Vit. K
Folate
Folate
0%
0%
0%
5.2%
26%
6.9%
48%
0%
18%
0%
0%
9.8%
7
100 g
300 g
1 cup, chopped - 130g
Vitamin C
Vit. C
Vitamin D
Vit. D
Vitamin A
Vit. A
Vitamin E
Vit. E
Vitamin B1
Vit. B1
Vitamin B2
Vit. B2
Vitamin B3
Vit. B3
Vitamin B5
Vit. B5
Vitamin B6
Vit. B6
Vitamin B12
Vit. B12
Vitamin K
Vit. K
Folate
Folate
137%
0%
227%
17%
13%
16%
9.4%
2.9%
32%
0%
2043%
9.8%
All nutrients comparison - raw data values
Nutrient
DV% diff.
Vitamin K
817µg
681%
Vitamin A
0µg
681µg
76%
Vitamin C
0mg
41mg
46%
Manganese
1.091mg
0.416mg
29%
Phosphorus
150mg
28mg
17%
Vitamin B3
2.57mg
0.5mg
13%
Iron
1.67mg
0.9mg
10%
Zinc
1.25mg
0.24mg
9%
Fiber
3.9g
2g
8%
Starch
19.57g
8%
Protein
5.5g
1.9g
7%
Carbs
26.44g
5.63g
7%
Magnesium
49mg
18mg
7%
Copper
0.215mg
0.156mg
7%
Calcium
10mg
72mg
6%
Selenium
4µg
0.9µg
6%
Calories
127kcal
28kcal
5%
Vitamin E
0.26mg
0.85mg
4%
Vitamin B1
0.103mg
0.053mg
4%
Vitamin B6
0.08mg
0.138mg
4%
Potassium
143mg
228mg
3%
Vitamin B2
0.03mg
0.07mg
3%
Fats
0.85g
0.4g
1%
Sodium
5mg
23mg
1%
Vitamin B5
0.049mg
1%
Polyunsaturated fat
0.193g
1%
Protein per 100 calories
4.3g
6.8g
N/A
Calories per 10 g protein
231kcal
147kcal
N/A
Weight per 100 calories
79g
357g
N/A
Net carbs
22.54g
3.63g
N/A
Sugar
1.25g
N/A
Folate
13µg
13µg
0%
Choline
0.4mg
0%
Saturated fat
0.052g
0%
Monounsaturated fat
0.03g
0%
Tryptophan
0.023mg
0%
Threonine
0.085mg
0%
Isoleucine
0.114mg
0%
Leucine
0.133mg
0%
Lysine
0.114mg
0%
Methionine
0.018mg
0%
Phenylalanine
0.097mg
0%
Valine
0.104mg
0%
Histidine
0.04mg
0%
Macronutrient Comparison
Macronutrient breakdown side-by-side comparison
3
6%
26%
67%
Protein:
5.5 g
Fats:
0.85 g
Carbs:
26.44 g
Water:
66.56 g
Other:
0.65 g
2
2%
6%
91%
Protein:
1.9 g
Fats:
0.4 g
Carbs:
5.63 g
Water:
91.2 g
Other:
0.87 g
Contains
more
Protein Protein
+189.5%
Contains
more
Fats Fats
+112.5%
Contains
more
Carbs Carbs
+369.6%
Contains
more
Water Water
+37%
Contains
more
Other Other
+33.8%