Spinach vs. Collard Greens — Health Impact and Nutrition Comparison


Summary
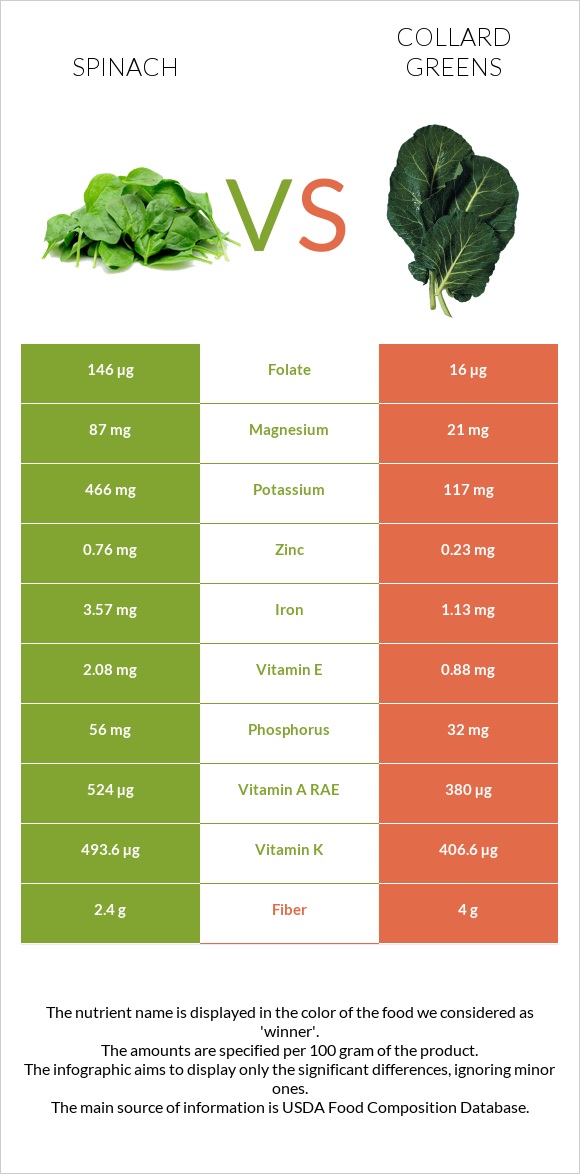
Spinach is richer in manganese, copper, zinc, potassium, phosphorus, magnesium, and iron. It is also richer in vitamin A, K, E, and B complex vitamins. In comparison, collard greens are richer in vitamin C and fiber. They are high in oxalate. The oxalate in spinach reduces magnesium bioavailability.
Introduction
This article compares two leafy greens; spinach and collard green. These two leafy greens are nutrient-dense and versatile greens that are used all around the world in different cuisines.
This article will compare them according to some of their general differences, nutritional content, and health impacts.
Let’s deep dive into their differences and see which is better than the other, or maybe they are beneficial to add to your diet.
General differences
Appearance and taste
Collard greens are wide green leaves that are dark green and have thick stems.
Collard greens have a harder texture and are more bitter in flavor. Collard greens are almost always cooked before eating, so this bitterness and hard texture are gone.
In comparison, spinach has a smaller leaf and a short and unremarkable stem. It is lighter in color, has a milder flavor, and can be eaten raw or cooked.
Collard greens are wider, greener, and have thick stems. The flavor profile is bitter and needs cooking before eating. In comparison, spinach is more delicate, smaller, and has a milder flavor. It can be cooked or eaten raw.
Preparation
Spinach does not have a stem. Spinach is often eaten raw in a salad or cooked by steaming or panfrying on low heat. On the other hand, collard green has a stem that can be removed and used for other purposes in cooking. The leaves are cooked for eating.
Nutritional content comparison
In this section, we will compare 100g of each. The nutritional content section compares them in boiled and drained forms.
Calories
They are very low in calories, almost insignificant.
Carbs and fiber
Collard greens are richer in fiber. Thus, they are slightly higher in carbs. However, collard greens are a great source of fiber. Here most of the carbohydrate content comes from fibers.
Proteins
Their protein content is similar and insignificant.
Fats
Their fat content is insignificant.
Macronutrient Comparison
Contains
more
OtherOther
+144.6%
Contains
more
FatsFats
+176.9%
Contains
more
CarbsCarbs
+50.7%
Minerals
Spinach is the mineral dense between these two leafy vegetables. Spinach is richer in manganese, copper, zinc, potassium, phosphorus, magnesium, and iron.
Below we can see their mineral distributions.
Mineral Comparison
Contains
more
MagnesiumMagnesium
+314.3%
Contains
more
PotassiumPotassium
+298.3%
Contains
more
IronIron
+215.9%
Contains
more
CopperCopper
+241.2%
Contains
more
ZincZinc
+230.4%
Contains
more
PhosphorusPhosphorus
+75%
Contains
more
ManganeseManganese
+83.3%
Contains
more
SeleniumSelenium
+200%
Contains
less
SodiumSodium
-78.6%
Vitamins
Spinach is richer in:
Vitamin B1 (thiamine)
Vitamin B2 (riboflavin)
Vitamin B6 (pyridoxine)
Folate
Vitamin K
Vitamin A
Vitamin E
In comparison, collards are richer in vitamin C. It is important to mention that collards are rich in vitamins A and K. However, comparatively, spinach is richer in these vitamins.
Below we can see their vitamin distributions.
Vitamin Comparison
Contains
more
Vitamin AVitamin A
+37.9%
Contains
more
Vitamin EVitamin E
+136.4%
Contains
more
Vitamin B1Vitamin B1
+137.5%
Contains
more
Vitamin B2Vitamin B2
+122.6%
Contains
more
Vitamin B6Vitamin B6
+89.1%
Contains
more
Vitamin KVitamin K
+21.4%
Contains
more
FolateFolate
+812.5%
Contains
more
Vitamin CVitamin C
+85.7%
Contains
more
Vitamin B3Vitamin B3
+17.3%
Contains
more
Vitamin B5Vitamin B5
+50.3%
Health impacts
Oxalate and kidney stones
Spinach is higher in oxalate than collard greens. However, it is essential to mention that collard greens are also high in oxalates. Spinach increases the risk of developing oxalate stones.
Higher oxalate consumption is linked with increased risks of kidney stone formation. (1)
However, since oxalate is a water-soluble compound boiling and cooking vegetables more often reduces the oxalate content by more than 50%. (2)
We risk losing several nutrients, especially from the cooking process, since many vitamins are heat labile and from throwing away the water they were boiled in.
Antioxidants
Spinach is richer in zeaxanthin and lutein compared to collard greens. These are antioxidants that reduce the risks of cancer and oxidative damage. (3) (4)
Anemias
Spinach is richer in iron compared to collard greens. Intake of iron-rich foods such as spinach is associated with decreased risks of iron deficiency anemias. (5)
Health benefits regarding fiber
Spinach is richer in fiber and contains about 2.4 times more fiber than collard green. Intake of fiber is linked with improved gastrointestinal health, cardiovascular health, and metabolic health regarding diabetes and blood lipids. (6)
If you want to know more about spinach vs. kale, this article compares them in-depth.
References

Infographic
All nutrients comparison - raw data values
| Nutrient | |
|
DV% diff. |
| Vitamin K | 493.6µg | 406.6µg | 73% |
| Folate | 146µg | 16µg | 33% |
| Iron | 3.57mg | 1.13mg | 31% |
| Manganese | 0.935mg | 0.51mg | 18% |
| Magnesium | 87mg | 21mg | 16% |
| Vitamin A | 524µg | 380µg | 16% |
| Copper | 0.174mg | 0.051mg | 14% |
| Potassium | 466mg | 117mg | 10% |
| Vitamin B2 | 0.236mg | 0.106mg | 10% |
| Vitamin C | 9.8mg | 18.2mg | 9% |
| Vitamin B6 | 0.242mg | 0.128mg | 9% |
| Vitamin E | 2.08mg | 0.88mg | 8% |
| Fiber | 2.4g | 4g | 6% |
| Zinc | 0.76mg | 0.23mg | 5% |
| Vitamin B1 | 0.095mg | 0.04mg | 5% |
| Phosphorus | 56mg | 32mg | 3% |
| Choline | 19.7mg | 38.4mg | 3% |
| Sodium | 70mg | 15mg | 2% |
| Selenium | 1.5µg | 0.5µg | 2% |
| Calories | 23kcal | 33kcal | 1% |
| Protein | 2.97g | 2.71g | 1% |
| Fats | 0.26g | 0.72g | 1% |
| Carbs | 3.75g | 5.65g | 1% |
| Calcium | 136mg | 141mg | 1% |
| Vitamin B3 | 0.49mg | 0.575mg | 1% |
| Vitamin B5 | 0.145mg | 0.218mg | 1% |
| Protein per 100 calories | 13g | 8.2g | N/A |
| Calories per 10 g protein | 77kcal | 122kcal | N/A |
| Weight per 100 calories | 435g | 303g | N/A |
| Net carbs | 1.35g | 1.65g | N/A |
| Sugar | 0.43g | 0.4g | N/A |
| Saturated fat | 0.043g | 0.047g | 0% |
| Monounsaturated fat | 0.006g | 0.026g | 0% |
| Polyunsaturated fat | 0.109g | 0.173g | 0% |
| Tryptophan | 0.04mg | 0.027mg | 0% |
| Threonine | 0.127mg | 0.074mg | 0% |
| Isoleucine | 0.152mg | 0.086mg | 0% |
| Leucine | 0.231mg | 0.13mg | 0% |
| Lysine | 0.182mg | 0.101mg | 0% |
| Methionine | 0.055mg | 0.028mg | 0% |
| Phenylalanine | 0.134mg | 0.075mg | 0% |
| Valine | 0.168mg | 0.104mg | 0% |
| Histidine | 0.066mg | 0.04mg | 0% |
Fat Type Comparison
| Contains more Mono. FatMonounsaturated fat | +333.3% |
| Contains more Poly. FatPolyunsaturated fat | +58.7% |
People also compare


References
All the values for which the sources are not specified explicitly are taken from FDA’s Food Central. The exact link to the food presented on this page can be found below.
- Spinach - https://fdc.nal.usda.gov/fdc-app.html#/food-details/168463/nutrients
- Collard Greens - https://fdc.nal.usda.gov/fdc-app.html#/food-details/170407/nutrients
All the Daily Values are presented for males aged 31-50, for 2000-calorie diets.