
Sweet onion vs. Fiddlehead ferns — In-Depth Nutrition Comparison
Compare
How are sweet onions and fiddlehead ferns different?
- Fiddlehead ferns have more vitamin B3, copper, vitamin C, vitamin A, manganese, vitamin B2, iron, phosphorus, protein, and potassium than sweet onions.
- Daily need coverage for vitamin B3 for fiddlehead ferns is 30% higher.
Onions, sweet, raw and Fiddlehead ferns, raw are the varieties used in this article.
Infographic
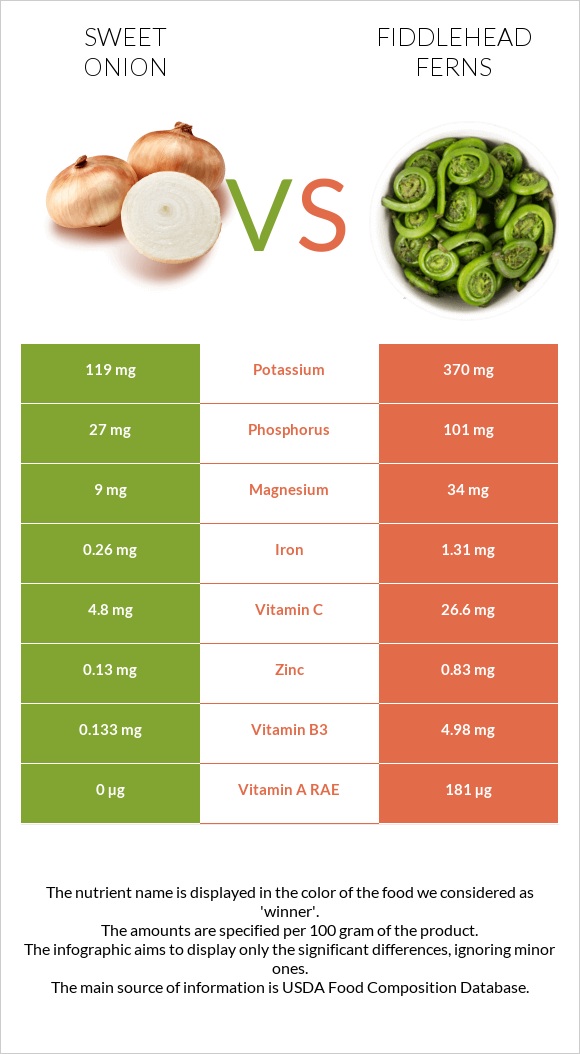
Infographic link
Mineral Comparison
The mineral comparison score is based on which food has a more favorable amount of each mineral. The �coverage� charts below show how much of the daily mineral needs are covered by the selected amount of each food.
| Contains more SeleniumSelenium | +∞% |
| Contains more MagnesiumMagnesium | +277.8% |
| Contains more CalciumCalcium | +60% |
| Contains more PotassiumPotassium | +210.9% |
| Contains more IronIron | +403.8% |
| Contains more CopperCopper | +471.4% |
| Contains more ZincZinc | +538.5% |
| Contains more PhosphorusPhosphorus | +274.1% |
| Contains less SodiumSodium | -87.5% |
| Contains more ManganeseManganese | +571.1% |
Vitamin Comparison
The vitamin comparison score is based on the number of vitamins in which one food is richer than the other. The �coverage� charts below show how much of the daily vitamin needs are covered by the selected amount of each food.
| Contains more Vitamin EVitamin E | +∞% |
| Contains more Vitamin B1Vitamin B1 | +105% |
| Contains more Vitamin B5Vitamin B5 | +∞% |
| Contains more Vitamin B6Vitamin B6 | +∞% |
| Contains more Vitamin KVitamin K | +∞% |
| Contains more FolateFolate | +∞% |
| Contains more Vitamin CVitamin C | +454.2% |
| Contains more Vitamin AVitamin A | +∞% |
| Contains more Vitamin B2Vitamin B2 | +950% |
| Contains more Vitamin B3Vitamin B3 | +3644.4% |
All nutrients comparison - raw data values
| Nutrient |  |
 |
DV% diff. |
| Vitamin B3 | 0.133mg | 4.98mg | 30% |
| Copper | 0.056mg | 0.32mg | 29% |
| Vitamin C | 4.8mg | 26.6mg | 24% |
| Vitamin A | 0µg | 181µg | 20% |
| Manganese | 0.076mg | 0.51mg | 19% |
| Vitamin B2 | 0.02mg | 0.21mg | 15% |
| Iron | 0.26mg | 1.31mg | 13% |
| Phosphorus | 27mg | 101mg | 11% |
| Vitamin B6 | 0.13mg | 10% | |
| Protein | 0.8g | 4.55g | 8% |
| Potassium | 119mg | 370mg | 7% |
| Magnesium | 9mg | 34mg | 6% |
| Zinc | 0.13mg | 0.83mg | 6% |
| Folate | 23µg | 6% | |
| Fiber | 0.9g | 4% | |
| Fructose | 2.02g | 3% | |
| Vitamin B1 | 0.041mg | 0.02mg | 2% |
| Vitamin B5 | 0.098mg | 2% | |
| Carbs | 7.55g | 5.54g | 1% |
| Calcium | 20mg | 32mg | 1% |
| Selenium | 0.5µg | 1% | |
| Choline | 5.5mg | 1% | |
| Calories | 32kcal | 34kcal | 0% |
| Protein per 100 calories | 2.5g | 13g | N/A |
| Calories per 10 g protein | 400kcal | 75kcal | N/A |
| Weight per 100 calories | 313g | 294g | N/A |
| Fats | 0.08g | 0.4g | 0% |
| Net carbs | 6.65g | 5.54g | N/A |
| Sugar | 5.02g | N/A | |
| Sodium | 8mg | 1mg | 0% |
| Vitamin E | 0.02mg | 0% | |
| Vitamin K | 0.3µg | 0% | |
| Tryptophan | 0.009mg | 0% | |
| Threonine | 0.018mg | 0% | |
| Isoleucine | 0.014mg | 0% | |
| Leucine | 0.025mg | 0% | |
| Lysine | 0.033mg | 0% | |
| Methionine | 0.009mg | 0% | |
| Phenylalanine | 0.024mg | 0% | |
| Valine | 0.02mg | 0% | |
| Histidine | 0.011mg | 0% |
Macronutrient Comparison
Macronutrient breakdown side-by-side comparison
Protein:
0.8 g
Fats:
0.08 g
Carbs:
7.55 g
Water:
91.24 g
Other:
0.33 g
Protein:
4.55 g
Fats:
0.4 g
Carbs:
5.54 g
Water:
88.68 g
Other:
0.83 g
| Contains more CarbsCarbs | +36.3% |
| Contains more ProteinProtein | +468.8% |
| Contains more FatsFats | +400% |
~equal in
Water
~88.68g


