Tabletop Sweeteners vs. Sugar — In-Depth Nutrition Comparison
Compare
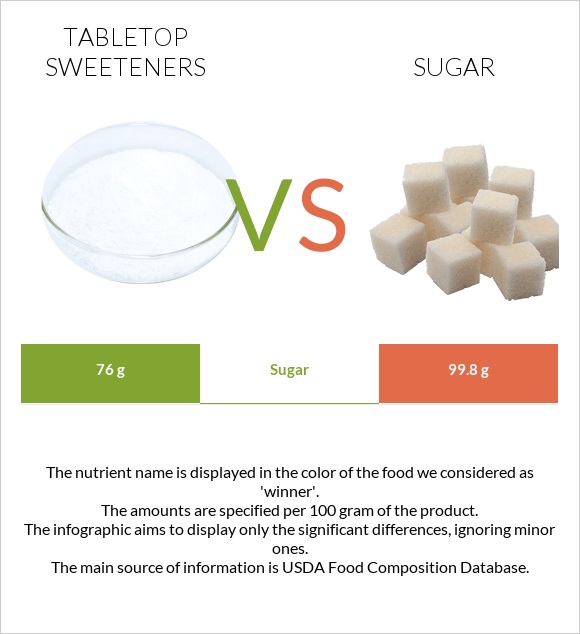
Summary of differences between tabletop Sweeteners and sugar
- The glycemic index of sugar is higher.
These are the specific foods used in this comparison Sweeteners, tabletop, fructose, liquid and Sugars, granulated.
Infographic
Infographic link
Mineral Comparison
Mineral comparison score is based on the number of minerals by which one or the other food is richer. The "coverage" charts below show how much of the daily needs can be covered by 300 grams of the food.
| Contains more IronIron | +120% |
| Contains more CopperCopper | +428.6% |
| Contains more ZincZinc | +800% |
| Contains more PotassiumPotassium | +∞% |
| Contains less SodiumSodium | -50% |
| Contains more SeleniumSelenium | +20% |
Vitamin Comparison
Vitamin comparison score is based on the number of vitamins by which one or the other food is richer. The "coverage" charts below show how much of the daily needs can be covered by 300 grams of the food.
All nutrients comparison - raw data values
| Nutrient |  |
 |
DV% diff. |
| Carbs | 76.1g | 99.98g | 8% |
| Calories | 279kcal | 387kcal | 5% |
| Copper | 0.037mg | 0.007mg | 3% |
| Iron | 0.11mg | 0.05mg | 1% |
| Zinc | 0.09mg | 0.01mg | 1% |
| Weight per 100 calories | 36g | 26g | N/A |
| Net carbs | 76g | 99.98g | N/A |
| Calcium | 1mg | 1mg | 0% |
| Potassium | 0mg | 2mg | 0% |
| Sugar | 76g | 99.8g | N/A |
| Fiber | 0.1g | 0g | 0% |
| Sodium | 2mg | 1mg | 0% |
| Manganese | 0.004mg | 0% | |
| Selenium | 0.5µg | 0.6µg | 0% |
| Vitamin B2 | 0.02mg | 0.019mg | 0% |
Macronutrient Comparison
Macronutrient breakdown side-by-side comparison
Protein:
0 g
Fats:
0 g
Carbs:
76.1 g
Water:
23.9 g
Other:
0 g
Protein:
0 g
Fats:
0 g
Carbs:
99.98 g
Water:
0.02 g
Other:
0 g
| Contains more WaterWater | +119400% |
| Contains more CarbsCarbs | +31.4% |
~equal in
Protein
~0g
~equal in
Fats
~0g
~equal in
Other
~0g


