Sugar nutrition: calories, carbs, GI, protein, fiber, fats
Sugars, granulated
*all the values are displayed for the amount of 100 grams

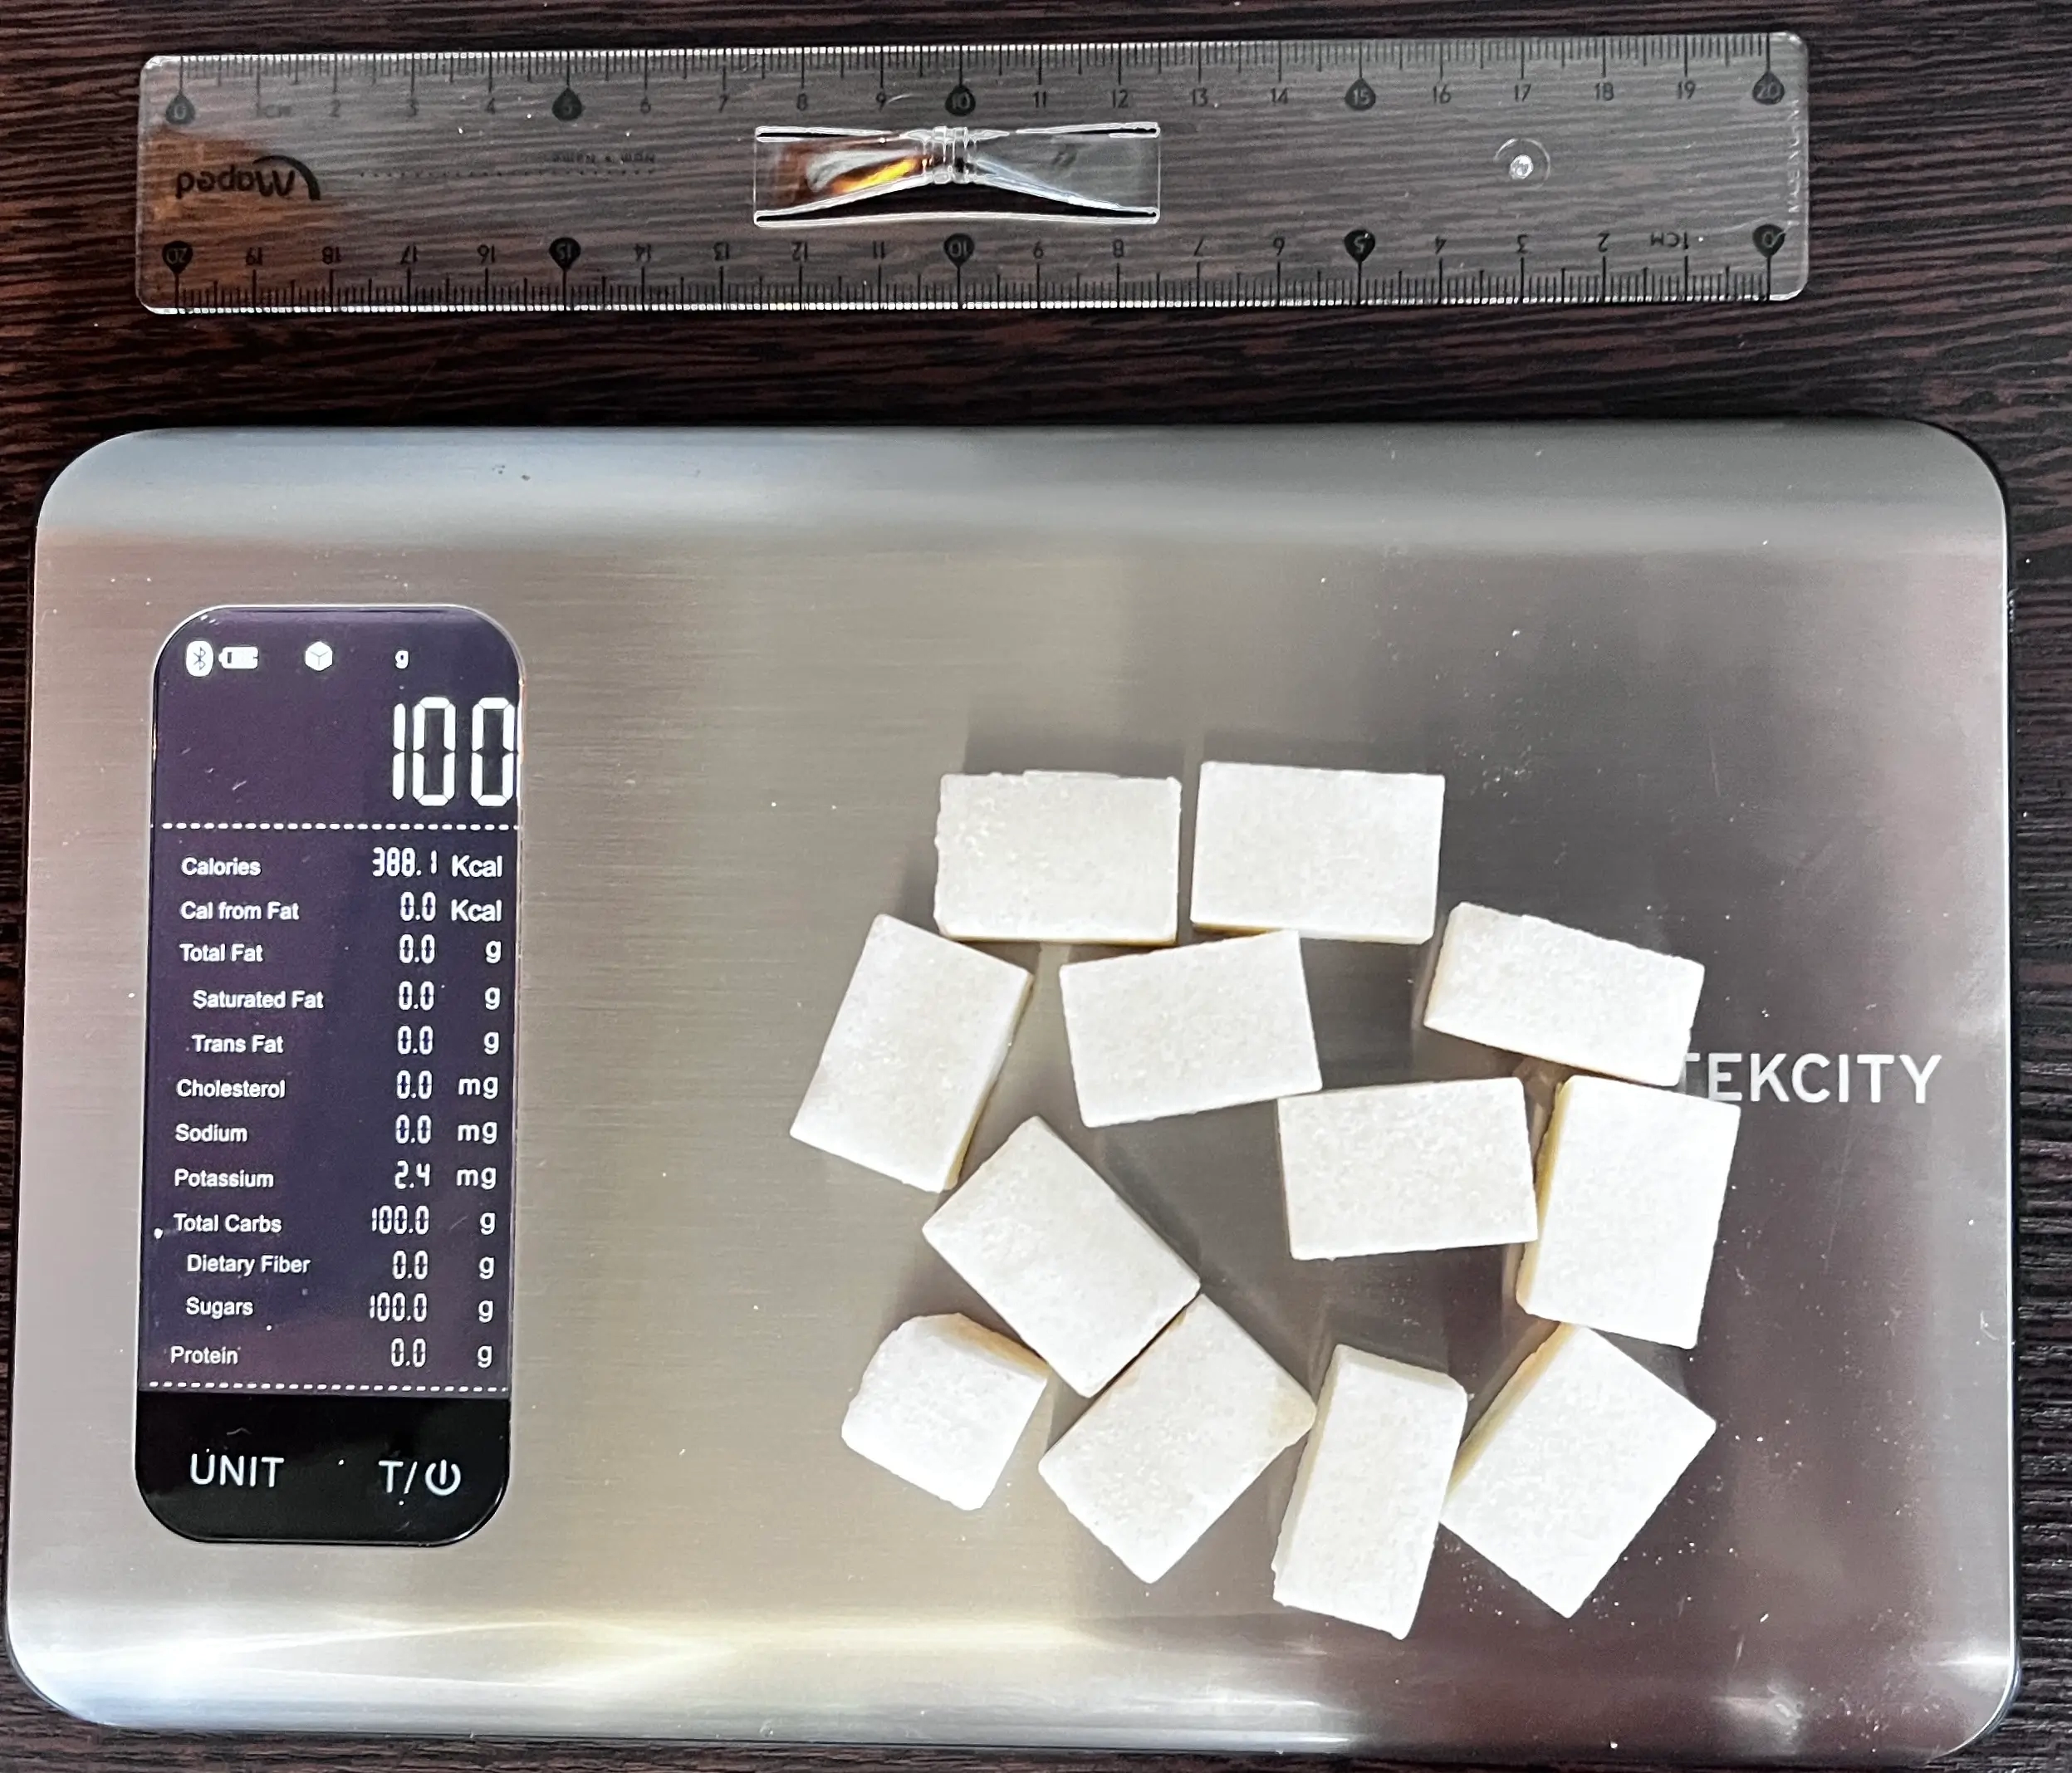
What Do 388 Calories or 100 Grams of Granulated Sugar Look Like?
The picture below illustrates what 388 calories or 100 grams of granulated sugar look like, giving a visual reference for its weight and energy content. One sugar granule weighs about 8 grams, so it takes 11.5 granules to make 100 grams. A typical serving size is 1 teaspoon (4.2 g), which provides approximately 16 calories.
Top nutrition facts for Sugar
| Calories ⓘ Calories for selected serving | 387 kcal |
|
Glycemic index ⓘ
Source:
Check out our Glycemic index chart page for the full list.
|
65 (medium) |
| Glycemic load ⓘ Glycemic Load (GL) is a metric that measures both the quality (Glycemic Index) and quantity of carbohydrates in a specific serving of food to estimate its impact on blood sugar levels. It is calculated as: (GI × Carbs in grams) / 100. | 3 (low) |
| Net carbs ⓘ Net Carbs = Total Carbohydrates – Fiber – Sugar Alcohols | 100 g |
| Default serving size ⓘ Serving sizes are mostly taken from FDA's Reference Amounts Customarily Consumed (RACCs) | 1 tsp (4.2 g) |
| Acidity (Based on PRAL) ⓘ PRAL (Potential renal acid load) is calculated using a formula. On the PRAL scale the higher the positive value, the more is the acidifying effect on the body. The lower the negative value, the higher the alkalinity of the food. 0 is neutral. | -0.1 (neutral) |
| Oxalates | 0 mg ⓘ https://www.hsph.harvard.edu/nutrition-questionnaire-service-center/nutrient-tables-download-page/ |
Sugar calories (kcal)
| Calories for different serving sizes of sugar | Calories | Weight |
|---|---|---|
| Calories in 100 grams | 387 | |
| Calories in 1 serving 1 cube | 9 | 2.3 g |
| Calories in 1 serving packet | 11 | 2.8 g |
| Calories in 1 tsp | 16 | 4.2 g |
| Calories in 1 cup | 774 | 200 g |
Extra Nutrition facts for Sugar
| Weight per 100 calories ⓘ Shows how many grams of this food equal 100 kcal—higher grams mean a larger portion for the same calories. | 26 g |
| Processing score ⓘ The processing score is a calculated value that looks at both how industrially made it is (NOVA) and how healthy/unprocessed the ingredients are (SIGA), then combines them into one score from 1 (least processed) to 4 (most processed). | 2.3 - Minimally processed ⓘ NOVA score = 2, SIGA score = B2 |
Sugar Glycemic index (GI)
Source:
Check out our Glycemic index chart page for the full list.
Sugar Glycemic load (GL)
Mineral coverage chart
Mineral chart - relative view
Vitamin coverage chart
Vitamin A:
0µg of 900µg
0%
Vitamin E:
0mg of 15mg
0%
Vitamin D:
0µg of 20µg
0%
Vitamin C:
0mg of 90mg
0%
Vitamin B1:
0mg of 1mg
0%
Vitamin B2:
0.06mg of 1mg
4.4%
Vitamin B3:
0mg of 16mg
0%
Vitamin B5:
0mg of 5mg
0%
Vitamin B6:
0mg of 1mg
0%
Folate:
0µg of 400µg
0%
Vitamin B12:
0µg of 2µg
0%
Vitamin K:
0µg of 120µg
0%
Vitamin chart - relative view
Macronutrients chart
Protein:
Daily Value: 0%
0 g of 50 g
0 g (0% of DV )
Fats:
Daily Value: 0%
0 g of 65 g
0 g (0% of DV )
Carbs:
Daily Value: 33%
100 g of 300 g
100 g (33% of DV )
Water:
Daily Value: 0%
0 g of 2,000 g
0 g (0% of DV )
Other:
0 g
0 g
Carbohydrate type breakdown
Starch:
0 g
Sucrose:
100 g
Glucose:
0 g
Fructose:
0 g
Lactose:
0 g
Maltose:
0 g
Galactose:
0 g
Fiber content ratio for Sugar
Sugar:
100 g
Fiber:
0 g
Other:
0.18 g
All nutrients for Sugar per 100g
| Nutrient | Value | DV% | In TOP % of foods | Comparison |
| Vitamin A | 0µg | 0% | 100% | |
| Calories | 387kcal | 19% | 17% |
8.2 times more than Orange
|
| Weight per 100 calories | 26g | N/A | 84% | |
| Protein | 0g | 0% | 100% |
N/A
|
| Fats | 0g | 0% | 100% |
N/A
|
| Vitamin C | 0mg | 0% | 100% |
N/A
|
| Net carbs | 100g | N/A | 1% |
1.8 times more than Chocolate
|
| Carbs | 100g | 33% | 1% |
3.5 times more than Rice
|
| Cholesterol | 0mg | 0% | 100% |
N/A
|
| Vitamin D* | 0 IU | 0% | 100% |
N/A
|
| Vitamin D | 0µg | 0% | 100% |
N/A
|
| Magnesium | 0mg | 0% | 100% |
N/A
|
| Calcium | 1mg | 0% | 93% |
125 times less than Milk
|
| Potassium | 2mg | 0% | 94% |
73.5 times less than Cucumber
|
| Iron | 0.05mg | 1% | 94% |
52 times less than Beef broiled
|
| Sugar | 100g | N/A | 1% |
11.1 times more than Coca-Cola
|
| Fiber | 0g | 0% | 100% |
N/A
|
| Copper | 0.01mg | 1% | 83% |
20.3 times less than Shiitake
|
| Zinc | 0.01mg | 0% | 90% |
631 times less than Beef broiled
|
| Phosphorus | 0mg | 0% | 100% |
N/A
|
| Sodium | 1mg | 0% | 97% |
490 times less than White bread
|
| Vitamin E | 0mg | 0% | 100% |
N/A
|
| Selenium | 0.6µg | 1% | 69% | |
| Manganese | 0mg | 0% | 72% | |
| Vitamin B1 | 0mg | 0% | 100% |
N/A
|
| Vitamin B2 | 0.02mg | 1% | 86% |
6.8 times less than Avocado
|
| Vitamin B3 | 0mg | 0% | 100% |
N/A
|
| Vitamin B5 | 0mg | 0% | 100% |
N/A
|
| Vitamin B6 | 0mg | 0% | 100% |
N/A
|
| Vitamin B12 | 0µg | 0% | 100% |
N/A
|
| Vitamin K | 0µg | 0% | 100% |
N/A
|
| Folate | 0µg | 0% | 100% |
N/A
|
| Choline | 0mg | 0% | 100% | |
| Saturated fat | 0g | 0% | 100% |
N/A
|
| Monounsaturated fat | 0g | N/A | 100% |
N/A
|
| Polyunsaturated fat | 0g | N/A | 100% |
N/A
|
| Fructose | 0g | 0% | 100% |
N/A
|
| Caffeine | 0mg | 0% | 100% | |
| Omega-3 - EPA | 0g | N/A | 100% |
N/A
|
| Omega-3 - DHA | 0g | N/A | 100% |
N/A
|
| Omega-3 - DPA | 0g | N/A | 100% |
N/A
|
Check out similar food or compare with current
NUTRITION FACTS LABEL
Nutrition Facts
___servings per container
Serving Size ______________
Serving Size ______________
Amount Per 100g
Calories 387
% Daily Value*
0
Total Fat
0g
0
Saturated Fat 0g
0
Trans Fat
0g
0
Cholesterol 0mg
0.04%
Sodium 1mg
33%
Total Carbohydrate
100g
0
Dietary Fiber
0g
Total Sugars 0g
Includes ? g Added Sugars
Protein
0g
Vitamin D
0mcg
0
Calcium
1mg
0.1%
Iron
0.05mg
0.63%
Potassium
2mg
0.06%
*
The % Daily Value (DV) tells you how much a nutrient in a serving of food contributes to a daily diet. 2,000 calories a day is used for general nutrition advice.
Health checks
ⓘ
Dietary cholesterol is not associated with an increased risk of coronary heart disease in healthy individuals. However, dietary cholesterol is common in foods that are high in harmful saturated fats.
Source
Low in Cholesterol
ⓘ
Trans fat consumption increases the risk of cardiovascular disease and mortality by negatively affecting blood lipid levels.
Source
No Trans Fats
ⓘ
Saturated fat intake can raise total cholesterol and LDL (low-density lipoprotein) levels, leading to an increased risk of atherosclerosis. Dietary guidelines recommend limiting saturated fats to under 10% of calories a day.
Source
Low in Saturated Fats
ⓘ
While the consumption of moderate amounts of added sugars is not detrimental to health, an excessive intake can increase the risk of obesity, and therefore, diabetes.
Source
Low in Sugars
Sugar nutrition infographic
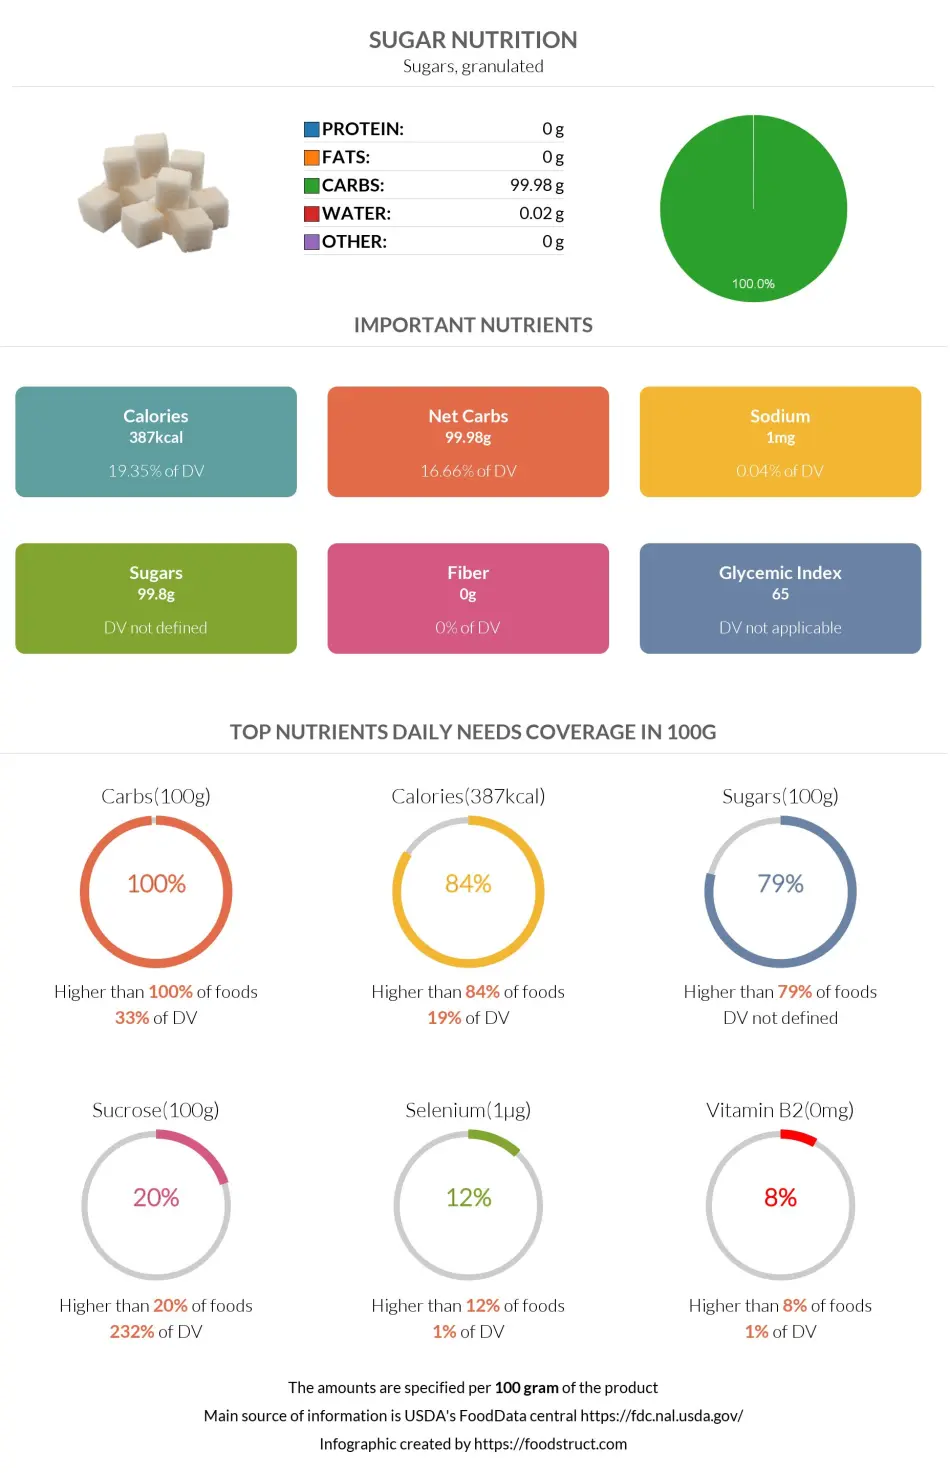
Infographic link
References
All the values for which the sources are not specified explicitly are taken from FDA’s Food Central. The exact link to the food presented on this page can be found below.