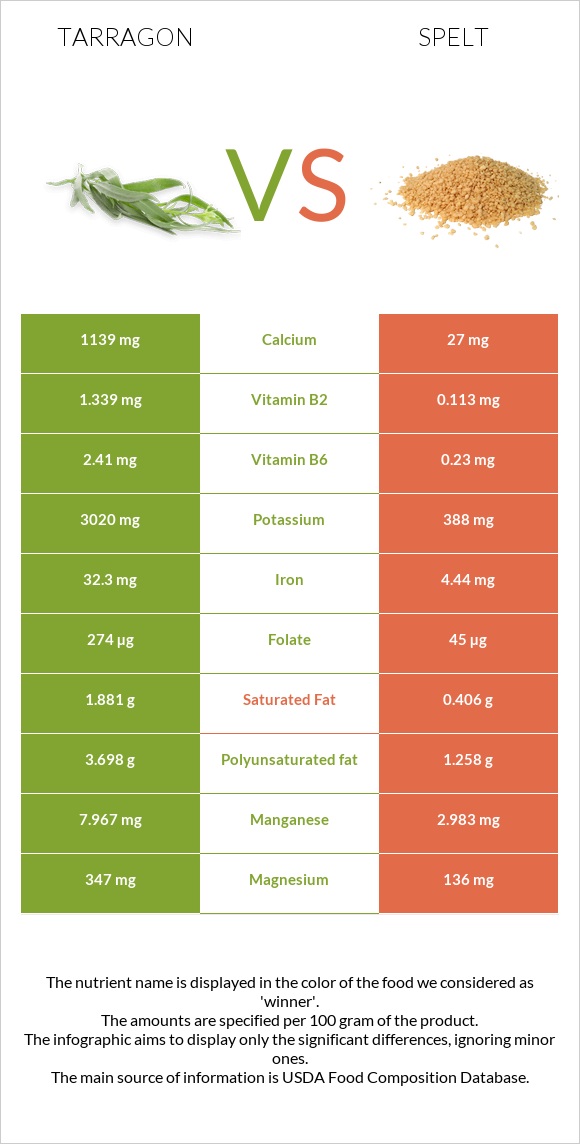
Differences between tarragon and spelt Tarragon is higher than spelt in iron, manganese, vitamin B6, calcium, vitamin B2, vitamin A, potassium, folate, vitamin C, and magnesium. Tarragon's daily need coverage for iron is 348% higher. Tarragon has a lower glycemic index (0) than spelt (63). The food types used in this comparison are Spices, tarragon, dried and Spelt, uncooked .
Infographic
Mineral Comparison
Mineral comparison score is based on the number of minerals by which one or the other food is richer. The "coverage" charts below show how much of the daily needs can be covered by 300 grams of the food.
7
100 g
300 g
0.25 tsp - 0.5g 1 tsp, ground - 1.6g 1 tbsp, leaves - 1.8g 1 tbsp, ground - 4.8g
Magnesium
Magnesium
Calcium
Calcium
Potassium
Potassium
Iron
Iron
Copper
Copper
Zinc
Zinc
Phosphorus
Phosphorus
Sodium
Sodium
Manganese
Manganese
Selenium
Selenium
248%
342%
266%
1211%
226%
106%
134%
8.1%
1039%
24%
3
100 g
300 g
1 cup - 174g
Magnesium
Magnesium
Calcium
Calcium
Potassium
Potassium
Iron
Iron
Copper
Copper
Zinc
Zinc
Phosphorus
Phosphorus
Sodium
Sodium
Manganese
Manganese
Selenium
Selenium
97%
8.1%
34%
167%
170%
89%
172%
1%
389%
64%
Vitamin Comparison
Vitamin comparison score is based on the number of vitamins by which one or the other food is richer. The "coverage" charts below show how much of the daily needs can be covered by 300 grams of the food.
6
100 g
300 g
0.25 tsp - 0.5g 1 tsp, ground - 1.6g 1 tbsp, leaves - 1.8g 1 tbsp, ground - 4.8g
Vitamin C
Vit. C
Vitamin D
Vit. D
Vitamin A
Vit. A
Vitamin E
Vit. E
Vitamin B1
Vit. B1
Vitamin B2
Vit. B2
Vitamin B3
Vit. B3
Vitamin B5
Vit. B5
Vitamin B6
Vit. B6
Vitamin B12
Vit. B12
Vitamin K
Vit. K
Folate
Folate
167%
0%
70%
0%
63%
309%
168%
0%
556%
0%
0%
206%
4
100 g
300 g
1 cup - 174g
Vitamin C
Vit. C
Vitamin D
Vit. D
Vitamin A
Vit. A
Vitamin E
Vit. E
Vitamin B1
Vit. B1
Vitamin B2
Vit. B2
Vitamin B3
Vit. B3
Vitamin B5
Vit. B5
Vitamin B6
Vit. B6
Vitamin B12
Vit. B12
Vitamin K
Vit. K
Folate
Folate
0%
0%
0%
16%
91%
26%
128%
64%
53%
0%
9%
34%
All nutrients comparison - raw data values
Nutrient
DV% diff.
Iron
32.3mg
4.44mg
348%
Manganese
7.967mg
2.983mg
217%
Vitamin B6
2.41mg
0.23mg
168%
Calcium
1139mg
27mg
111%
Vitamin B2
1.339mg
0.113mg
94%
Potassium
3020mg
388mg
77%
Folate
274µg
45µg
57%
Vitamin C
50mg
0mg
56%
Magnesium
347mg
136mg
50%
Vitamin A
210µg
0µg
23%
Starch
53.92g
22%
Vitamin B5
1.068mg
21%
Copper
0.677mg
0.511mg
18%
Protein
22.77g
14.57g
16%
Polyunsaturated fat
3.698g
1.258g
16%
Fiber
7.4g
10.7g
13%
Phosphorus
313mg
401mg
13%
Selenium
4.4µg
11.7µg
13%
Vitamin B3
8.95mg
6.843mg
13%
Vitamin B1
0.251mg
0.364mg
9%
Fats
7.24g
2.43g
7%
Carbs
50.22g
70.19g
7%
Saturated fat
1.881g
0.406g
7%
Zinc
3.9mg
3.28mg
6%
Vitamin E
0.79mg
5%
Vitamin K
3.6µg
3%
Calories
295kcal
338kcal
2%
Sodium
62mg
8mg
2%
Protein per 100 calories
7.7g
4.3g
N/A
Calories per 10 g protein
130kcal
232kcal
N/A
Weight per 100 calories
34g
30g
N/A
Unsaturated / Saturated Fat ratio
2.2
4.2
N/A
Net carbs
42.82g
59.49g
N/A
Sugar
6.82g
N/A
Monounsaturated fat
0.474g
0.445g
0%
Tryptophan
0.132mg
0%
Threonine
0.443mg
0%
Isoleucine
0.552mg
0%
Leucine
1.07mg
0%
Lysine
0.409mg
0%
Methionine
0.258mg
0%
Phenylalanine
0.737mg
0%
Valine
0.681mg
0%
Histidine
0.36mg
0%
Fructose
0.24g
0%
Omega-3 - ALA
0.065g
N/A
Macronutrient Comparison
Macronutrient breakdown side-by-side comparison
3
23%
7%
50%
8%
12%
Protein:
22.77 g
Fats:
7.24 g
Carbs:
50.22 g
Water:
7.74 g
Other:
12.03 g
2
15%
2%
70%
11%
2%
Protein:
14.57 g
Fats:
2.43 g
Carbs:
70.19 g
Water:
11.02 g
Other:
1.79 g
Contains
more
Protein Protein
+56.3%
Contains
more
Fats Fats
+197.9%
Contains
more
Other Other
+572.1%
Contains
more
Carbs Carbs
+39.8%
Contains
more
Water Water
+42.4%
Fat Type Comparison
Fat type breakdown side-by-side comparison
2
31%
8%
61%
Saturated fat:
Sat. Fat
1.881 g
Monounsaturated fat:
Mono. Fat
0.474 g
Polyunsaturated fat:
Poly. Fat
3.698 g
1
19%
21%
60%
Saturated fat:
Sat. Fat
0.406 g
Monounsaturated fat:
Mono. Fat
0.445 g
Polyunsaturated fat:
Poly. Fat
1.258 g
Contains
more
Poly. Fat Polyunsaturated fat
+194%
Contains
less
Sat. Fat Saturated fat
-78.4%
~equal in
Monounsaturated fat
~0.445g