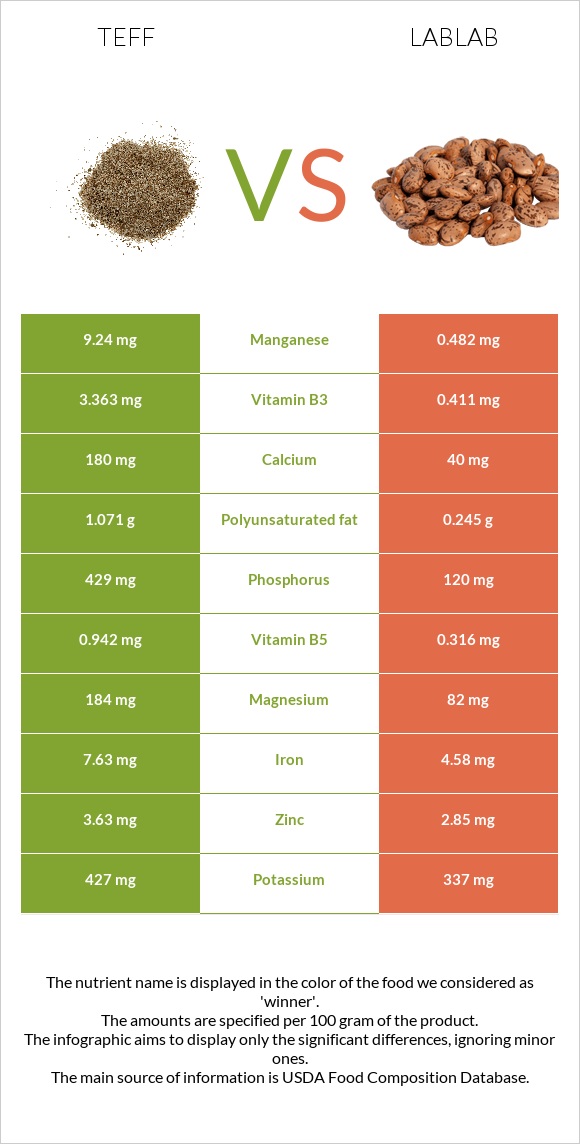
Significant differences between teff and lablab The amount of manganese, copper, phosphorus, iron, vitamin B6, magnesium, vitamin B3, vitamin B2, calcium, and vitamin B5 in teff is higher than in lablab. Teff covers your daily manganese needs 381% more than lablab. Lablab has 13 times less vitamin B6 than teff. Teff has 0.482mg of vitamin B6, while lablab has 0.037mg. Specific food types used in this comparison are Teff, uncooked and Hyacinth beans, mature seeds, cooked, boiled, without salt .
Infographic
Mineral Comparison
Mineral comparison score is based on the number of minerals by which one or the other food is richer. The "coverage" charts below show how much of the daily needs can be covered by 300 grams of the food.
9
100 g
300 g
1 cup - 193g
Magnesium
Magnesium
Calcium
Calcium
Potassium
Potassium
Iron
Iron
Copper
Copper
Zinc
Zinc
Phosphorus
Phosphorus
Sodium
Sodium
Manganese
Manganese
Selenium
Selenium
131%
54%
38%
286%
270%
99%
184%
1.6%
1205%
24%
1
100 g
300 g
1 cup - 194g
Magnesium
Magnesium
Calcium
Calcium
Potassium
Potassium
Iron
Iron
Copper
Copper
Zinc
Zinc
Phosphorus
Phosphorus
Sodium
Sodium
Manganese
Manganese
Selenium
Selenium
59%
12%
30%
172%
114%
78%
51%
0.91%
63%
15%
Vitamin Comparison
Vitamin comparison score is based on the number of vitamins by which one or the other food is richer. The "coverage" charts below show how much of the daily needs can be covered by 300 grams of the food.
7
100 g
300 g
1 cup - 193g
Vitamin C
Vit. C
Vitamin D
Vit. D
Vitamin A
Vit. A
Vitamin E
Vit. E
Vitamin B1
Vit. B1
Vitamin B2
Vit. B2
Vitamin B3
Vit. B3
Vitamin B5
Vit. B5
Vitamin B6
Vit. B6
Vitamin B12
Vit. B12
Vitamin K
Vit. K
Folate
Folate
0%
0%
0%
1.6%
98%
62%
63%
57%
111%
0%
4.8%
0%
1
100 g
300 g
1 cup - 194g
Vitamin C
Vit. C
Vitamin D
Vit. D
Vitamin A
Vit. A
Vitamin E
Vit. E
Vitamin B1
Vit. B1
Vitamin B2
Vit. B2
Vitamin B3
Vit. B3
Vitamin B5
Vit. B5
Vitamin B6
Vit. B6
Vitamin B12
Vit. B12
Vitamin K
Vit. K
Folate
Folate
0%
0%
0%
0%
68%
8.5%
7.7%
19%
8.5%
0%
0%
3%
All nutrients comparison - raw data values
Nutrient
DV% diff.
Manganese
9.24mg
0.482mg
381%
Copper
0.81mg
0.341mg
52%
Phosphorus
429mg
120mg
44%
Iron
7.63mg
4.58mg
38%
Vitamin B6
0.482mg
0.037mg
34%
Fiber
8g
32%
Magnesium
184mg
82mg
24%
Vitamin B2
0.27mg
0.037mg
18%
Vitamin B3
3.363mg
0.411mg
18%
Carbs
73.13g
20.69g
17%
Starch
36.56g
15%
Calcium
180mg
40mg
14%
Calories
367kcal
117kcal
13%
Vitamin B5
0.942mg
0.316mg
13%
Protein
13.3g
8.14g
10%
Vitamin B1
0.39mg
0.27mg
10%
Zinc
3.63mg
2.85mg
7%
Polyunsaturated fat
1.071g
0.245g
6%
Fats
2.38g
0.58g
3%
Potassium
427mg
337mg
3%
Selenium
4.4µg
2.8µg
3%
Vitamin K
1.9µg
2%
Choline
13.1mg
2%
Saturated fat
0.449g
0.099g
2%
Vitamin E
0.08mg
1%
Folate
4µg
1%
Monounsaturated fat
0.589g
0.026g
1%
Fructose
0.47g
1%
Protein per 100 calories
3.6g
7g
N/A
Calories per 10 g protein
276kcal
144kcal
N/A
Weight per 100 calories
27g
85g
N/A
Unsaturated / Saturated Fat ratio
3.7
2.7
N/A
Net carbs
65.13g
20.69g
N/A
Sugar
1.84g
N/A
Sodium
12mg
7mg
0%
Tryptophan
0.139mg
0.068mg
0%
Threonine
0.51mg
0.315mg
0%
Isoleucine
0.501mg
0.39mg
0%
Leucine
1.068mg
0.691mg
0%
Lysine
0.376mg
0.556mg
0%
Methionine
0.428mg
0.065mg
0%
Phenylalanine
0.698mg
0.41mg
0%
Valine
0.686mg
0.422mg
0%
Histidine
0.301mg
0.233mg
0%
Omega-3 - ALA
0.135g
N/A
Macronutrient Comparison
Macronutrient breakdown side-by-side comparison
4
13%
2%
73%
9%
2%
Protein:
13.3 g
Fats:
2.38 g
Carbs:
73.13 g
Water:
8.82 g
Other:
2.37 g
1
8%
21%
69%
Protein:
8.14 g
Fats:
0.58 g
Carbs:
20.69 g
Water:
69.13 g
Other:
1.46 g
Contains
more
Protein Protein
+63.4%
Contains
more
Fats Fats
+310.3%
Contains
more
Carbs Carbs
+253.5%
Contains
more
Other Other
+62.3%
Contains
more
Water Water
+683.8%
Fat Type Comparison
Fat type breakdown side-by-side comparison
2
21%
28%
51%
Saturated fat:
Sat. Fat
0.449 g
Monounsaturated fat:
Mono. Fat
0.589 g
Polyunsaturated fat:
Poly. Fat
1.071 g
1
27%
7%
66%
Saturated fat:
Sat. Fat
0.099 g
Monounsaturated fat:
Mono. Fat
0.026 g
Polyunsaturated fat:
Poly. Fat
0.245 g
Contains
more
Mono. Fat Monounsaturated fat
+2165.4%
Contains
more
Poly. Fat Polyunsaturated fat
+337.1%
Contains
less
Sat. Fat Saturated fat
-78%