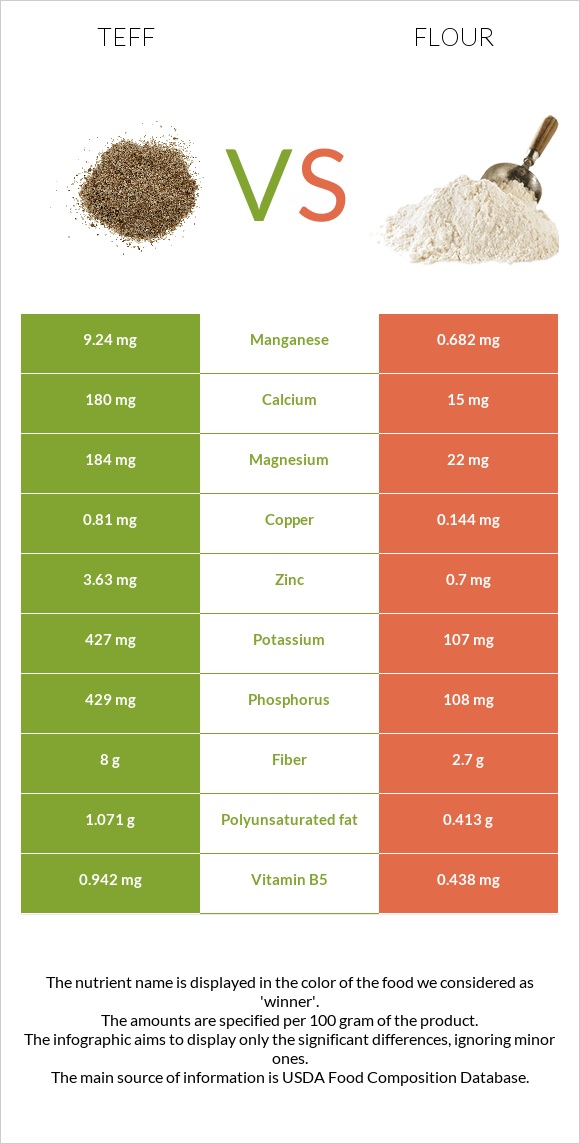
Summary of differences between teff and flour Teff has more manganese, copper, phosphorus, magnesium, iron, vitamin B6, zinc, and fiber, while flour has more selenium and vitamin B1. Teff covers your daily need for manganese, 372% more than flour. Teff contains 11 times more vitamin B6 than flour. While teff contains 0.482mg of vitamin B6, flour contains only 0.044mg. These are the specific foods used in this comparison Teff, uncooked and Wheat flour, white, all-purpose, enriched, bleached .
Infographic
Mineral Comparison
Mineral comparison score is based on the number of minerals by which one or the other food is richer. The "coverage" charts below show how much of the daily needs can be covered by 300 grams of the food.
8
100 g
300 g
1 cup - 193g
Magnesium
Magnesium
Calcium
Calcium
Potassium
Potassium
Iron
Iron
Copper
Copper
Zinc
Zinc
Phosphorus
Phosphorus
Sodium
Sodium
Manganese
Manganese
Selenium
Selenium
131%
54%
38%
286%
270%
99%
184%
1.6%
1205%
24%
2
100 g
300 g
1 cup - 125g
Magnesium
Magnesium
Calcium
Calcium
Potassium
Potassium
Iron
Iron
Copper
Copper
Zinc
Zinc
Phosphorus
Phosphorus
Sodium
Sodium
Manganese
Manganese
Selenium
Selenium
16%
4.5%
9.4%
174%
48%
19%
46%
0.26%
89%
185%
Vitamin Comparison
Vitamin comparison score is based on the number of vitamins by which one or the other food is richer. The "coverage" charts below show how much of the daily needs can be covered by 300 grams of the food.
4
100 g
300 g
1 cup - 193g
Vitamin C
Vit. C
Vitamin D
Vit. D
Vitamin A
Vit. A
Vitamin E
Vit. E
Vitamin B1
Vit. B1
Vitamin B2
Vit. B2
Vitamin B3
Vit. B3
Vitamin B5
Vit. B5
Vitamin B6
Vit. B6
Vitamin B12
Vit. B12
Vitamin K
Vit. K
Folate
Folate
0%
0%
0%
1.6%
98%
62%
63%
57%
111%
0%
4.8%
0%
4
100 g
300 g
1 cup - 125g
Vitamin C
Vit. C
Vitamin D
Vit. D
Vitamin A
Vit. A
Vitamin E
Vit. E
Vitamin B1
Vit. B1
Vitamin B2
Vit. B2
Vitamin B3
Vit. B3
Vitamin B5
Vit. B5
Vitamin B6
Vit. B6
Vitamin B12
Vit. B12
Vitamin K
Vit. K
Folate
Folate
0%
0%
0%
1.2%
196%
114%
111%
26%
10%
0%
0.75%
137%
All nutrients comparison - raw data values
Nutrient
DV% diff.
Manganese
9.24mg
0.682mg
372%
Copper
0.81mg
0.144mg
74%
Selenium
4.4µg
33.9µg
54%
Phosphorus
429mg
108mg
46%
Folate
183µg
46%
Magnesium
184mg
22mg
39%
Iron
7.63mg
4.64mg
37%
Vitamin B6
0.482mg
0.044mg
34%
Vitamin B1
0.39mg
0.785mg
33%
Zinc
3.63mg
0.7mg
27%
Fiber
8g
2.7g
21%
Calcium
180mg
15mg
17%
Vitamin B2
0.27mg
0.494mg
17%
Vitamin B3
3.363mg
5.904mg
16%
Starch
36.56g
15%
Vitamin B5
0.942mg
0.438mg
10%
Potassium
427mg
107mg
9%
Protein
13.3g
10.33g
6%
Polyunsaturated fat
1.071g
0.413g
4%
Fats
2.38g
0.98g
2%
Carbs
73.13g
76.31g
1%
Vitamin K
1.9µg
0.3µg
1%
Saturated fat
0.449g
0.155g
1%
Monounsaturated fat
0.589g
0.087g
1%
Fructose
0.47g
1%
Calories
367kcal
364kcal
0%
Protein per 100 calories
3.6g
2.8g
N/A
Calories per 10 g protein
276kcal
352kcal
N/A
Weight per 100 calories
27g
27g
N/A
Unsaturated / Saturated Fat ratio
3.7
3.2
N/A
Net carbs
65.13g
73.61g
N/A
Sugar
1.84g
0.27g
N/A
Sodium
12mg
2mg
0%
Vitamin E
0.08mg
0.06mg
0%
Choline
13.1mg
10.4mg
0%
Tryptophan
0.139mg
0.127mg
0%
Threonine
0.51mg
0.281mg
0%
Isoleucine
0.501mg
0.357mg
0%
Leucine
1.068mg
0.71mg
0%
Lysine
0.376mg
0.228mg
0%
Methionine
0.428mg
0.183mg
0%
Phenylalanine
0.698mg
0.52mg
0%
Valine
0.686mg
0.415mg
0%
Histidine
0.301mg
0.23mg
0%
Omega-3 - ALA
0.135g
N/A
Macronutrient Comparison
Macronutrient breakdown side-by-side comparison
3
13%
2%
73%
9%
2%
Protein:
13.3 g
Fats:
2.38 g
Carbs:
73.13 g
Water:
8.82 g
Other:
2.37 g
2
10%
76%
12%
Protein:
10.33 g
Fats:
0.98 g
Carbs:
76.31 g
Water:
11.92 g
Other:
0.46 g
Contains
more
Protein Protein
+28.8%
Contains
more
Fats Fats
+142.9%
Contains
more
Other Other
+415.2%
Contains
more
Water Water
+35.1%
Fat Type Comparison
Fat type breakdown side-by-side comparison
2
21%
28%
51%
Saturated fat:
Sat. Fat
0.449 g
Monounsaturated fat:
Mono. Fat
0.589 g
Polyunsaturated fat:
Poly. Fat
1.071 g
1
24%
13%
63%
Saturated fat:
Sat. Fat
0.155 g
Monounsaturated fat:
Mono. Fat
0.087 g
Polyunsaturated fat:
Poly. Fat
0.413 g
Contains
more
Mono. Fat Monounsaturated fat
+577%
Contains
more
Poly. Fat Polyunsaturated fat
+159.3%
Contains
less
Sat. Fat Saturated fat
-65.5%