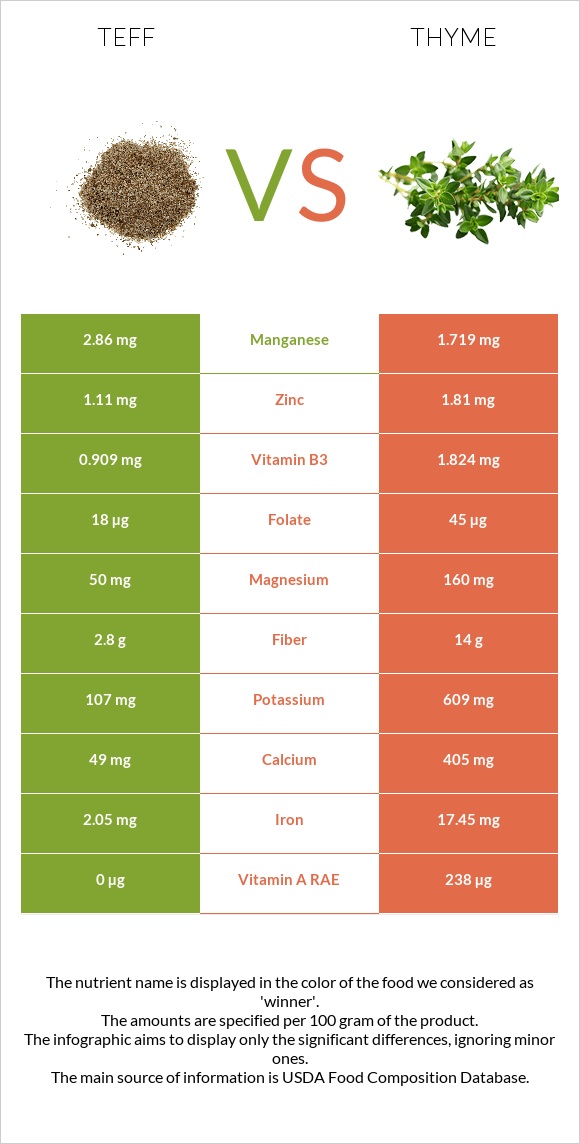
Important differences between teff and thyme Teff has more manganese; however, thyme has more iron, vitamin A, fiber, copper, calcium, vitamin B2, magnesium, vitamin B6, and potassium. Thyme's daily need coverage for iron is 193% more. Teff has 2 times more manganese than thyme. Teff has 2.86mg of manganese, while thyme has 1.719mg. Teff has a higher glycemic index than thyme. The food varieties used in the comparison are Teff, cooked and Thyme, fresh .
Infographic
Mineral Comparison
Mineral comparison score is based on the number of minerals by which one or the other food is richer. The "coverage" charts below show how much of the daily needs can be covered by 300 grams of the food.
3
100 g
300 g
1 cup - 252g
Magnesium
Magnesium
Calcium
Calcium
Potassium
Potassium
Iron
Iron
Copper
Copper
Zinc
Zinc
Phosphorus
Phosphorus
Sodium
Sodium
Manganese
Manganese
Selenium
Selenium
36%
15%
9.4%
77%
75%
30%
51%
1%
373%
0%
6
100 g
300 g
0.5 tsp - 0.4g 1 tsp - 0.8g
Magnesium
Magnesium
Calcium
Calcium
Potassium
Potassium
Iron
Iron
Copper
Copper
Zinc
Zinc
Phosphorus
Phosphorus
Sodium
Sodium
Manganese
Manganese
Selenium
Selenium
114%
122%
54%
654%
185%
49%
45%
1.2%
224%
0%
Vitamin Comparison
Vitamin comparison score is based on the number of vitamins by which one or the other food is richer. The "coverage" charts below show how much of the daily needs can be covered by 300 grams of the food.
1
100 g
300 g
1 cup - 252g
Vitamin C
Vit. C
Vitamin D
Vit. D
Vitamin A
Vit. A
Vitamin E
Vit. E
Vitamin B1
Vit. B1
Vitamin B2
Vit. B2
Vitamin B3
Vit. B3
Vitamin B5
Vit. B5
Vitamin B6
Vit. B6
Vitamin B12
Vit. B12
Vitamin K
Vit. K
Folate
Folate
0%
0%
0%
0%
46%
7.6%
17%
0%
22%
0%
0%
14%
7
100 g
300 g
0.5 tsp - 0.4g 1 tsp - 0.8g
Vitamin C
Vit. C
Vitamin D
Vit. D
Vitamin A
Vit. A
Vitamin E
Vit. E
Vitamin B1
Vit. B1
Vitamin B2
Vit. B2
Vitamin B3
Vit. B3
Vitamin B5
Vit. B5
Vitamin B6
Vit. B6
Vitamin B12
Vit. B12
Vitamin K
Vit. K
Folate
Folate
534%
0%
79%
0%
12%
109%
34%
25%
80%
0%
0%
34%
All nutrients comparison - raw data values
Nutrient
DV% diff.
Iron
2.05mg
17.45mg
193%
Vitamin C
160.1mg
178%
Manganese
2.86mg
1.719mg
50%
Fiber
2.8g
14g
45%
Copper
0.226mg
0.555mg
37%
Calcium
49mg
405mg
36%
Vitamin B2
0.033mg
0.471mg
34%
Magnesium
50mg
160mg
26%
Vitamin A
0µg
238µg
26%
Vitamin B6
0.097mg
0.348mg
19%
Potassium
107mg
609mg
15%
Vitamin B1
0.183mg
0.048mg
11%
Vitamin B5
0.409mg
8%
Folate
18µg
45µg
7%
Zinc
1.11mg
1.81mg
6%
Vitamin B3
0.909mg
1.824mg
6%
Polyunsaturated fat
0.532g
4%
Protein
3.87g
5.56g
3%
Fats
0.65g
1.68g
2%
Carbs
19.86g
24.45g
2%
Phosphorus
120mg
106mg
2%
Saturated fat
0.467g
2%
Calories
101kcal
101kcal
0%
Protein per 100 calories
3.8g
5.5g
N/A
Calories per 10 g protein
261kcal
182kcal
N/A
Weight per 100 calories
99g
99g
N/A
Net carbs
17.06g
10.45g
N/A
Sodium
8mg
9mg
0%
Monounsaturated fat
0.081g
0%
Tryptophan
0.041mg
0.114mg
0%
Threonine
0.149mg
0.154mg
0%
Isoleucine
0.146mg
0.285mg
0%
Leucine
0.311mg
0.262mg
0%
Lysine
0.109mg
0.126mg
0%
Methionine
0.125mg
0%
Phenylalanine
0.203mg
0%
Valine
0.2mg
0.307mg
0%
Histidine
0.088mg
0%
Macronutrient Comparison
Macronutrient breakdown side-by-side comparison
1
4%
20%
75%
Protein:
3.87 g
Fats:
0.65 g
Carbs:
19.86 g
Water:
74.93 g
Other:
0.69 g
4
6%
2%
24%
65%
3%
Protein:
5.56 g
Fats:
1.68 g
Carbs:
24.45 g
Water:
65.11 g
Other:
3.2 g
Contains
more
Water Water
+15.1%
Contains
more
Protein Protein
+43.7%
Contains
more
Fats Fats
+158.5%
Contains
more
Carbs Carbs
+23.1%
Contains
more
Other Other
+363.8%