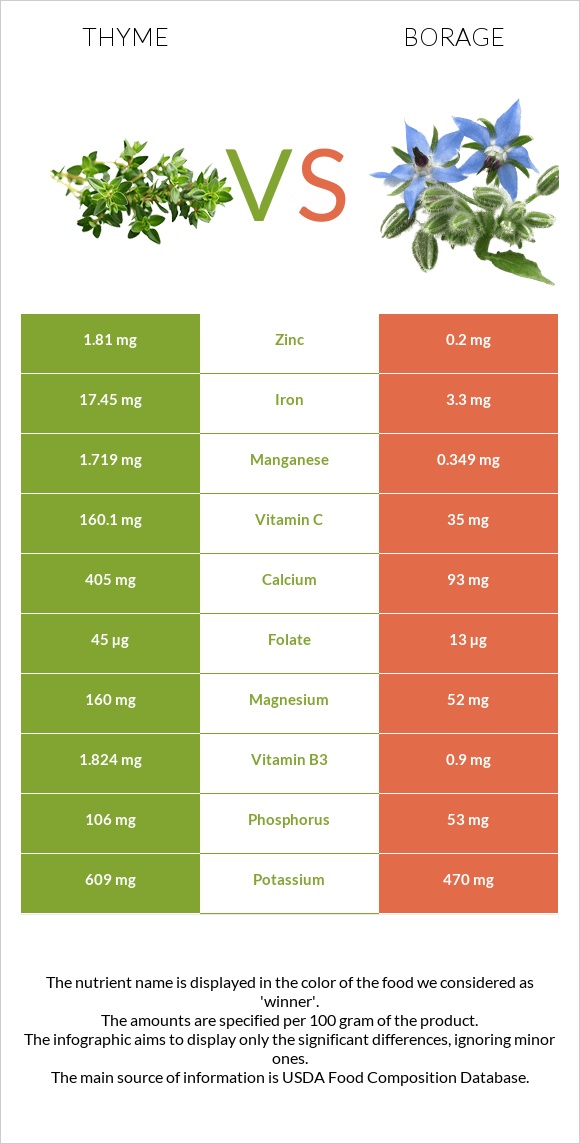
Important differences between thyme and borage Borage has less iron, vitamin C, manganese, copper, calcium, magnesium, vitamin B2, vitamin B6, zinc, and vitamin A. Thyme's daily need coverage for iron is 177% more. Thyme has 9 times more zinc than borage. Thyme has 1.81mg of zinc, while borage has 0.2mg. The food varieties used in the comparison are Thyme, fresh and Borage, raw .
Infographic
Mineral Comparison
Mineral comparison score is based on the number of minerals by which one or the other food is richer. The "coverage" charts below show how much of the daily needs can be covered by 300 grams of the food.
9
100 g
300 g
0.5 tsp - 0.4g 1 tsp - 0.8g
Magnesium
Magnesium
Calcium
Calcium
Potassium
Potassium
Iron
Iron
Copper
Copper
Zinc
Zinc
Phosphorus
Phosphorus
Sodium
Sodium
Manganese
Manganese
Selenium
Selenium
114%
122%
54%
654%
185%
49%
45%
1.2%
224%
0%
1
100 g
300 g
1 cup (1" pieces) - 89g
Magnesium
Magnesium
Calcium
Calcium
Potassium
Potassium
Iron
Iron
Copper
Copper
Zinc
Zinc
Phosphorus
Phosphorus
Sodium
Sodium
Manganese
Manganese
Selenium
Selenium
37%
28%
41%
124%
43%
5.5%
23%
10%
46%
4.9%
Vitamin Comparison
Vitamin comparison score is based on the number of vitamins by which one or the other food is richer. The "coverage" charts below show how much of the daily needs can be covered by 300 grams of the food.
7
100 g
300 g
0.5 tsp - 0.4g 1 tsp - 0.8g
Vitamin C
Vit. C
Vitamin D
Vit. D
Vitamin A
Vit. A
Vitamin E
Vit. E
Vitamin B1
Vit. B1
Vitamin B2
Vit. B2
Vitamin B3
Vit. B3
Vitamin B5
Vit. B5
Vitamin B6
Vit. B6
Vitamin B12
Vit. B12
Vitamin K
Vit. K
Folate
Folate
534%
0%
79%
0%
12%
109%
34%
25%
80%
0%
0%
34%
1
100 g
300 g
1 cup (1" pieces) - 89g
Vitamin C
Vit. C
Vitamin D
Vit. D
Vitamin A
Vit. A
Vitamin E
Vit. E
Vitamin B1
Vit. B1
Vitamin B2
Vit. B2
Vitamin B3
Vit. B3
Vitamin B5
Vit. B5
Vitamin B6
Vit. B6
Vitamin B12
Vit. B12
Vitamin K
Vit. K
Folate
Folate
117%
0%
70%
0%
15%
35%
17%
2.5%
19%
0%
0%
9.8%
All nutrients comparison - raw data values
Nutrient
DV% diff.
Iron
17.45mg
3.3mg
177%
Vitamin C
160.1mg
35mg
139%
Manganese
1.719mg
0.349mg
60%
Fiber
14g
56%
Copper
0.555mg
0.13mg
47%
Calcium
405mg
93mg
31%
Magnesium
160mg
52mg
26%
Vitamin B2
0.471mg
0.15mg
25%
Vitamin B6
0.348mg
0.084mg
20%
Zinc
1.81mg
0.2mg
15%
Protein
5.56g
1.8g
8%
Phosphorus
106mg
53mg
8%
Folate
45µg
13µg
8%
Carbs
24.45g
3.06g
7%
Vitamin B5
0.409mg
0.041mg
7%
Vitamin B3
1.824mg
0.9mg
6%
Calories
101kcal
21kcal
4%
Potassium
609mg
470mg
4%
Sodium
9mg
80mg
3%
Vitamin A
238µg
210µg
3%
Polyunsaturated fat
0.532g
0.109g
3%
Fats
1.68g
0.7g
2%
Selenium
0.9µg
2%
Vitamin B1
0.048mg
0.06mg
1%
Saturated fat
0.467g
0.17g
1%
Protein per 100 calories
5.5g
8.6g
N/A
Calories per 10 g protein
182kcal
117kcal
N/A
Weight per 100 calories
99g
476g
N/A
Net carbs
10.45g
3.06g
N/A
Monounsaturated fat
0.081g
0.211g
0%
Tryptophan
0.114mg
0%
Threonine
0.154mg
0%
Isoleucine
0.285mg
0%
Leucine
0.262mg
0%
Lysine
0.126mg
0%
Valine
0.307mg
0%
Macronutrient Comparison
Macronutrient breakdown side-by-side comparison
4
6%
2%
24%
65%
3%
Protein:
5.56 g
Fats:
1.68 g
Carbs:
24.45 g
Water:
65.11 g
Other:
3.2 g
1
2%
3%
93%
Protein:
1.8 g
Fats:
0.7 g
Carbs:
3.06 g
Water:
93 g
Other:
1.44 g
Contains
more
Protein Protein
+208.9%
Contains
more
Fats Fats
+140%
Contains
more
Carbs Carbs
+699%
Contains
more
Other Other
+122.2%
Contains
more
Water Water
+42.8%
Fat Type Comparison
Fat type breakdown side-by-side comparison
1
43%
8%
49%
Saturated fat:
Sat. Fat
0.467 g
Monounsaturated fat:
Mono. Fat
0.081 g
Polyunsaturated fat:
Poly. Fat
0.532 g
2
35%
43%
22%
Saturated fat:
Sat. Fat
0.17 g
Monounsaturated fat:
Mono. Fat
0.211 g
Polyunsaturated fat:
Poly. Fat
0.109 g
Contains
more
Poly. Fat Polyunsaturated fat
+388.1%
Contains
less
Sat. Fat Saturated fat
-63.6%
Contains
more
Mono. Fat Monounsaturated fat
+160.5%