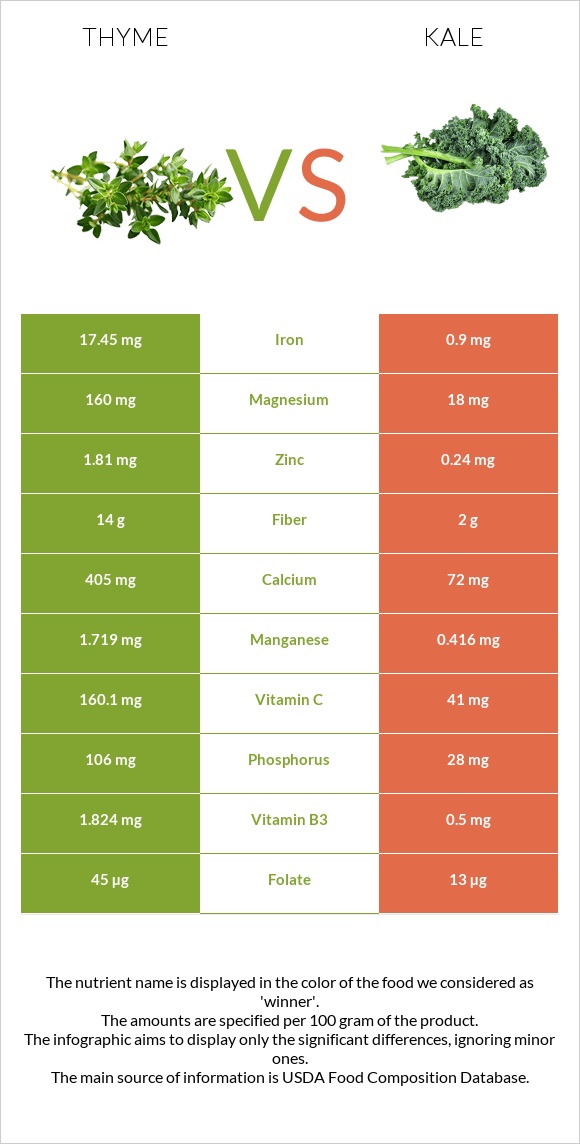
Summary of differences between thyme and kale Thyme has more iron, vitamin C, manganese, fiber, copper, magnesium, calcium, vitamin B2, and vitamin B6; however, kale is higher in vitamin A. Thyme covers your daily need for iron, 207% more than kale. Thyme has 9 times more magnesium than kale. While thyme has 160mg of magnesium, kale has only 18mg. These are the specific foods used in this comparison Thyme, fresh and Kale, cooked, boiled, drained, without salt .
Infographic
Mineral Comparison
Mineral comparison score is based on the number of minerals by which one or the other food is richer. The "coverage" charts below show how much of the daily needs can be covered by 300 grams of the food.
9
100 g
300 g
0.5 tsp - 0.4g 1 tsp - 0.8g
Magnesium
Magnesium
Calcium
Calcium
Potassium
Potassium
Iron
Iron
Copper
Copper
Zinc
Zinc
Phosphorus
Phosphorus
Sodium
Sodium
Manganese
Manganese
Selenium
Selenium
114%
122%
54%
654%
185%
49%
45%
1.2%
224%
0%
1
100 g
300 g
1 cup, chopped - 130g
Magnesium
Magnesium
Calcium
Calcium
Potassium
Potassium
Iron
Iron
Copper
Copper
Zinc
Zinc
Phosphorus
Phosphorus
Sodium
Sodium
Manganese
Manganese
Selenium
Selenium
13%
22%
20%
34%
52%
6.5%
12%
3%
54%
4.9%
Vitamin Comparison
Vitamin comparison score is based on the number of vitamins by which one or the other food is richer. The "coverage" charts below show how much of the daily needs can be covered by 300 grams of the food.
6
100 g
300 g
0.5 tsp - 0.4g 1 tsp - 0.8g
Vitamin C
Vit. C
Vitamin D
Vit. D
Vitamin A
Vit. A
Vitamin E
Vit. E
Vitamin B1
Vit. B1
Vitamin B2
Vit. B2
Vitamin B3
Vit. B3
Vitamin B5
Vit. B5
Vitamin B6
Vit. B6
Vitamin B12
Vit. B12
Vitamin K
Vit. K
Folate
Folate
534%
0%
79%
0%
12%
109%
34%
25%
80%
0%
0%
34%
4
100 g
300 g
1 cup, chopped - 130g
Vitamin C
Vit. C
Vitamin D
Vit. D
Vitamin A
Vit. A
Vitamin E
Vit. E
Vitamin B1
Vit. B1
Vitamin B2
Vit. B2
Vitamin B3
Vit. B3
Vitamin B5
Vit. B5
Vitamin B6
Vit. B6
Vitamin B12
Vit. B12
Vitamin K
Vit. K
Folate
Folate
137%
0%
227%
17%
13%
16%
9.4%
2.9%
32%
0%
2043%
9.8%
All nutrients comparison - raw data values
Nutrient
DV% diff.
Vitamin K
817µg
681%
Iron
17.45mg
0.9mg
207%
Vitamin C
160.1mg
41mg
132%
Manganese
1.719mg
0.416mg
57%
Vitamin A
238µg
681µg
49%
Fiber
14g
2g
48%
Copper
0.555mg
0.156mg
44%
Magnesium
160mg
18mg
34%
Calcium
405mg
72mg
33%
Vitamin B2
0.471mg
0.07mg
31%
Vitamin B6
0.348mg
0.138mg
16%
Zinc
1.81mg
0.24mg
14%
Potassium
609mg
228mg
11%
Phosphorus
106mg
28mg
11%
Vitamin B3
1.824mg
0.5mg
8%
Folate
45µg
13µg
8%
Protein
5.56g
1.9g
7%
Vitamin B5
0.409mg
0.049mg
7%
Carbs
24.45g
5.63g
6%
Vitamin E
0.85mg
6%
Calories
101kcal
28kcal
4%
Fats
1.68g
0.4g
2%
Selenium
0.9µg
2%
Saturated fat
0.467g
0.052g
2%
Polyunsaturated fat
0.532g
0.193g
2%
Sodium
9mg
23mg
1%
Protein per 100 calories
5.5g
6.8g
N/A
Calories per 10 g protein
182kcal
147kcal
N/A
Weight per 100 calories
99g
357g
N/A
Net carbs
10.45g
3.63g
N/A
Sugar
1.25g
N/A
Vitamin B1
0.048mg
0.053mg
0%
Choline
0.4mg
0%
Monounsaturated fat
0.081g
0.03g
0%
Tryptophan
0.114mg
0.023mg
0%
Threonine
0.154mg
0.085mg
0%
Isoleucine
0.285mg
0.114mg
0%
Leucine
0.262mg
0.133mg
0%
Lysine
0.126mg
0.114mg
0%
Methionine
0.018mg
0%
Phenylalanine
0.097mg
0%
Valine
0.307mg
0.104mg
0%
Histidine
0.04mg
0%
Macronutrient Comparison
Macronutrient breakdown side-by-side comparison
4
6%
2%
24%
65%
3%
Protein:
5.56 g
Fats:
1.68 g
Carbs:
24.45 g
Water:
65.11 g
Other:
3.2 g
1
2%
6%
91%
Protein:
1.9 g
Fats:
0.4 g
Carbs:
5.63 g
Water:
91.2 g
Other:
0.87 g
Contains
more
Protein Protein
+192.6%
Contains
more
Fats Fats
+320%
Contains
more
Carbs Carbs
+334.3%
Contains
more
Other Other
+267.8%
Contains
more
Water Water
+40.1%
Fat Type Comparison
Fat type breakdown side-by-side comparison
2
43%
8%
49%
Saturated fat:
Sat. Fat
0.467 g
Monounsaturated fat:
Mono. Fat
0.081 g
Polyunsaturated fat:
Poly. Fat
0.532 g
1
19%
11%
70%
Saturated fat:
Sat. Fat
0.052 g
Monounsaturated fat:
Mono. Fat
0.03 g
Polyunsaturated fat:
Poly. Fat
0.193 g
Contains
more
Mono. Fat Monounsaturated fat
+170%
Contains
more
Poly. Fat Polyunsaturated fat
+175.6%
Contains
less
Sat. Fat Saturated fat
-88.9%