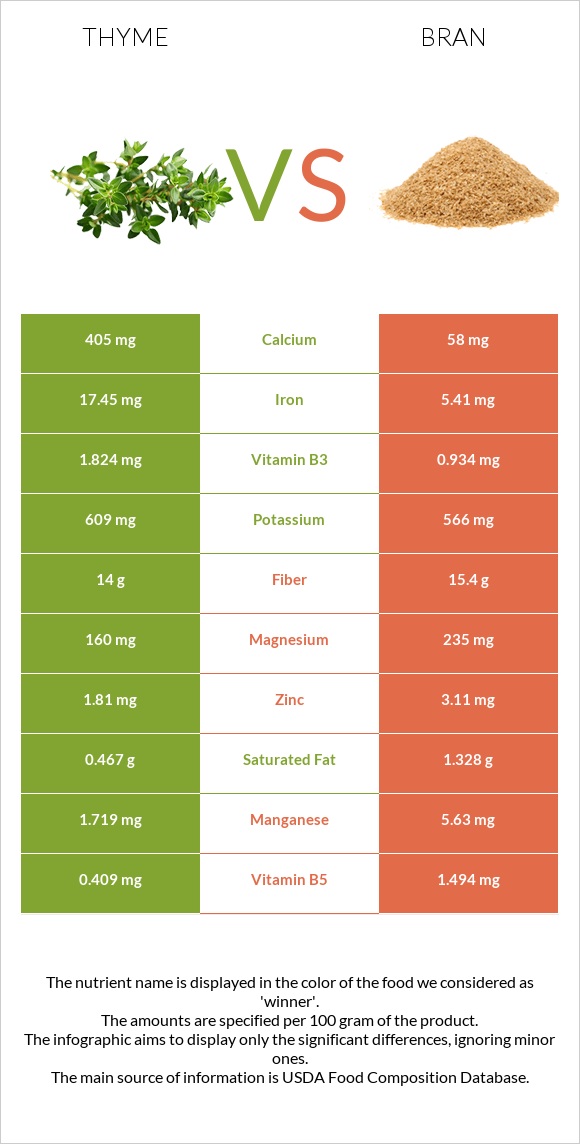
Summary of differences between thyme and bran Bran has less iron, vitamin C, vitamin A, copper, fiber, calcium, vitamin B2, manganese, magnesium, and vitamin B6 than thyme. Thyme covers your daily need for iron, 207% more than bran. The glycemic index of bran is higher. These are the specific foods used in this comparison Thyme, fresh and Oat bran, cooked .
Infographic
Mineral Comparison
Mineral comparison score is based on the number of minerals by which one or the other food is richer. The "coverage" charts below show how much of the daily needs can be covered by 300 grams of the food.
7
100 g
300 g
0.5 tsp - 0.4g 1 tsp - 0.8g
Magnesium
Magnesium
Calcium
Calcium
Potassium
Potassium
Iron
Iron
Copper
Copper
Zinc
Zinc
Phosphorus
Phosphorus
Sodium
Sodium
Manganese
Manganese
Selenium
Selenium
114%
122%
54%
654%
185%
49%
45%
1.2%
224%
0%
3
100 g
300 g
1 cup - 219g
Magnesium
Magnesium
Calcium
Calcium
Potassium
Potassium
Iron
Iron
Copper
Copper
Zinc
Zinc
Phosphorus
Phosphorus
Sodium
Sodium
Manganese
Manganese
Selenium
Selenium
29%
3%
8.1%
33%
22%
14%
51%
0.13%
126%
42%
Vitamin Comparison
Vitamin comparison score is based on the number of vitamins by which one or the other food is richer. The "coverage" charts below show how much of the daily needs can be covered by 300 grams of the food.
7
100 g
300 g
0.5 tsp - 0.4g 1 tsp - 0.8g
Vitamin C
Vit. C
Vitamin D
Vit. D
Vitamin A
Vit. A
Vitamin E
Vit. E
Vitamin B1
Vit. B1
Vitamin B2
Vit. B2
Vitamin B3
Vit. B3
Vitamin B5
Vit. B5
Vitamin B6
Vit. B6
Vitamin B12
Vit. B12
Vitamin K
Vit. K
Folate
Folate
534%
0%
79%
0%
12%
109%
34%
25%
80%
0%
0%
34%
1
100 g
300 g
1 cup - 219g
Vitamin C
Vit. C
Vitamin D
Vit. D
Vitamin A
Vit. A
Vitamin E
Vit. E
Vitamin B1
Vit. B1
Vitamin B2
Vit. B2
Vitamin B3
Vit. B3
Vitamin B5
Vit. B5
Vitamin B6
Vit. B6
Vitamin B12
Vit. B12
Vitamin K
Vit. K
Folate
Folate
0%
0%
0%
0%
40%
7.8%
2.7%
13%
5.8%
0%
0%
4.5%
All nutrients comparison - raw data values
Nutrient
DV% diff.
Iron
17.45mg
0.88mg
207%
Vitamin C
160.1mg
0mg
178%
Copper
0.555mg
0.066mg
54%
Fiber
14g
2.6g
46%
Calcium
405mg
10mg
40%
Vitamin B2
0.471mg
0.034mg
34%
Manganese
1.719mg
0.964mg
33%
Magnesium
160mg
40mg
29%
Vitamin A
238µg
0µg
26%
Vitamin B6
0.348mg
0.025mg
25%
Potassium
609mg
92mg
15%
Selenium
7.7µg
14%
Zinc
1.81mg
0.53mg
12%
Vitamin B3
1.824mg
0.144mg
11%
Folate
45µg
6µg
10%
Vitamin B1
0.048mg
0.16mg
9%
Protein
5.56g
3.21g
5%
Carbs
24.45g
11.44g
4%
Vitamin B5
0.409mg
0.217mg
4%
Calories
101kcal
40kcal
3%
Phosphorus
106mg
119mg
2%
Fats
1.68g
0.86g
1%
Saturated fat
0.467g
0.163g
1%
Monounsaturated fat
0.081g
0.291g
1%
Polyunsaturated fat
0.532g
0.339g
1%
Protein per 100 calories
5.5g
8g
N/A
Calories per 10 g protein
182kcal
125kcal
N/A
Weight per 100 calories
99g
250g
N/A
Net carbs
10.45g
8.84g
N/A
Sodium
9mg
1mg
0%
Tryptophan
0.114mg
0.057mg
0%
Threonine
0.154mg
0.086mg
0%
Isoleucine
0.285mg
0.114mg
0%
Leucine
0.262mg
0.235mg
0%
Lysine
0.126mg
0.13mg
0%
Methionine
0.057mg
0%
Phenylalanine
0.155mg
0%
Valine
0.307mg
0.165mg
0%
Histidine
0.07mg
0%
Macronutrient Comparison
Macronutrient breakdown side-by-side comparison
4
6%
2%
24%
65%
3%
Protein:
5.56 g
Fats:
1.68 g
Carbs:
24.45 g
Water:
65.11 g
Other:
3.2 g
1
3%
11%
84%
Protein:
3.21 g
Fats:
0.86 g
Carbs:
11.44 g
Water:
84 g
Other:
0.49 g
Contains
more
Protein Protein
+73.2%
Contains
more
Fats Fats
+95.3%
Contains
more
Carbs Carbs
+113.7%
Contains
more
Other Other
+553.1%
Contains
more
Water Water
+29%
Fat Type Comparison
Fat type breakdown side-by-side comparison
1
43%
8%
49%
Saturated fat:
Sat. Fat
0.467 g
Monounsaturated fat:
Mono. Fat
0.081 g
Polyunsaturated fat:
Poly. Fat
0.532 g
2
21%
37%
43%
Saturated fat:
Sat. Fat
0.163 g
Monounsaturated fat:
Mono. Fat
0.291 g
Polyunsaturated fat:
Poly. Fat
0.339 g
Contains
more
Poly. Fat Polyunsaturated fat
+56.9%
Contains
less
Sat. Fat Saturated fat
-65.1%
Contains
more
Mono. Fat Monounsaturated fat
+259.3%