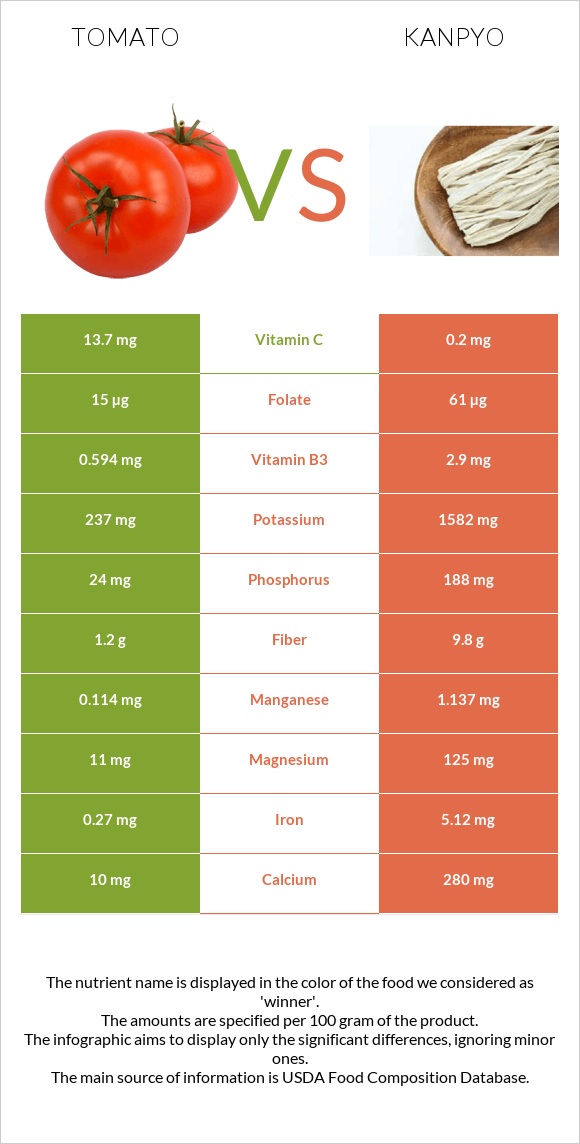
What are the main differences between tomatoes and kanpyo? Kanpyo has more iron, zinc, vitamin B5, manganese, copper, potassium, vitamin B6, fiber, magnesium, and calcium than tomatoes. Kanpyo's daily need coverage for iron is 61% higher. We used Tomatoes, red, ripe, raw, year round average and Kanpyo, (dried gourd strips) types in this comparison.
Infographic
Mineral Comparison
Mineral comparison score is based on the number of minerals by which one or the other food is richer. The "coverage" charts below show how much of the daily needs can be covered by 300 grams of the food.
1
100 g
300 g
1 slice, thin/small - 15g 1 cherry - 17g 1 slice, medium (1/4" thick) - 20g 1 slice, thick/large (1/2" thick) - 27g 1 wedge (1/4 of medium tomato) - 31g 1 Italian tomato - 62g 1 plum tomato - 62g 1 small whole (2-2/5" dia) - 91g 1 medium whole (2-3/5" dia) - 123g 1 NLEA serving - 148g 1 cup cherry tomatoes - 149g 1 cup, chopped or sliced - 180g 1 large whole (3" dia) - 182g
Magnesium
Magnesium
Calcium
Calcium
Potassium
Potassium
Iron
Iron
Copper
Copper
Zinc
Zinc
Phosphorus
Phosphorus
Sodium
Sodium
Manganese
Manganese
Selenium
Selenium
7.9%
3%
21%
10%
20%
4.6%
10%
0.65%
15%
0%
9
100 g
300 g
1 strip - 6.3g 0.5 cup - 27g
Magnesium
Magnesium
Calcium
Calcium
Potassium
Potassium
Iron
Iron
Copper
Copper
Zinc
Zinc
Phosphorus
Phosphorus
Sodium
Sodium
Manganese
Manganese
Selenium
Selenium
89%
84%
140%
192%
144%
160%
81%
2%
148%
14%
Vitamin Comparison
Vitamin comparison score is based on the number of vitamins by which one or the other food is richer. The "coverage" charts below show how much of the daily needs can be covered by 300 grams of the food.
5
100 g
300 g
1 slice, thin/small - 15g 1 cherry - 17g 1 slice, medium (1/4" thick) - 20g 1 slice, thick/large (1/2" thick) - 27g 1 wedge (1/4 of medium tomato) - 31g 1 Italian tomato - 62g 1 plum tomato - 62g 1 small whole (2-2/5" dia) - 91g 1 medium whole (2-3/5" dia) - 123g 1 NLEA serving - 148g 1 cup cherry tomatoes - 149g 1 cup, chopped or sliced - 180g 1 large whole (3" dia) - 182g
Vitamin C
Vit. C
Vitamin D
Vit. D
Vitamin A
Vit. A
Vitamin E
Vit. E
Vitamin B1
Vit. B1
Vitamin B2
Vit. B2
Vitamin B3
Vit. B3
Vitamin B5
Vit. B5
Vitamin B6
Vit. B6
Vitamin B12
Vit. B12
Vitamin K
Vit. K
Folate
Folate
46%
0%
14%
11%
9.3%
4.4%
11%
5.3%
18%
0%
20%
11%
5
100 g
300 g
1 strip - 6.3g 0.5 cup - 27g
Vitamin C
Vit. C
Vitamin D
Vit. D
Vitamin A
Vit. A
Vitamin E
Vit. E
Vitamin B1
Vit. B1
Vitamin B2
Vit. B2
Vitamin B3
Vit. B3
Vitamin B5
Vit. B5
Vitamin B6
Vit. B6
Vitamin B12
Vit. B12
Vitamin K
Vit. K
Folate
Folate
0.67%
0%
0%
0%
0%
10%
54%
153%
123%
0%
0%
46%
All nutrients comparison - raw data values
Nutrient
DV% diff.
Iron
0.27mg
5.12mg
61%
Zinc
0.17mg
5.86mg
52%
Vitamin B5
0.089mg
2.553mg
49%
Manganese
0.114mg
1.137mg
44%
Copper
0.059mg
0.433mg
42%
Potassium
237mg
1582mg
40%
Vitamin B6
0.08mg
0.532mg
35%
Fiber
1.2g
9.8g
34%
Magnesium
11mg
125mg
27%
Calcium
10mg
280mg
27%
Phosphorus
24mg
188mg
23%
Carbs
3.89g
65.03g
20%
Protein
0.88g
8.58g
15%
Vitamin C
13.7mg
0.2mg
15%
Vitamin B3
0.594mg
2.9mg
14%
Calories
18kcal
258kcal
12%
Folate
15µg
61µg
12%
Vitamin K
7.9µg
7%
Vitamin A
42µg
5%
Selenium
0µg
2.6µg
5%
Vitamin E
0.54mg
4%
Vitamin B1
0.037mg
0mg
3%
Vitamin B2
0.019mg
0.044mg
2%
Fructose
1.37g
2%
Fats
0.2g
0.56g
1%
Choline
6.7mg
1%
Polyunsaturated fat
0.083g
0.244g
1%
Protein per 100 calories
4.9g
3.3g
N/A
Calories per 10 g protein
205kcal
301kcal
N/A
Weight per 100 calories
556g
39g
N/A
Net carbs
2.69g
55.23g
N/A
Sugar
2.63g
N/A
Sodium
5mg
15mg
0%
Saturated fat
0.028g
0.045g
0%
Monounsaturated fat
0.031g
0.103g
0%
Tryptophan
0.006mg
0%
Threonine
0.027mg
0%
Isoleucine
0.018mg
0%
Leucine
0.025mg
0%
Lysine
0.027mg
0%
Methionine
0.006mg
0%
Phenylalanine
0.027mg
0%
Valine
0.018mg
0%
Histidine
0.014mg
0%
Macronutrient Comparison
Macronutrient breakdown side-by-side comparison
1
4%
95%
Protein:
0.88 g
Fats:
0.2 g
Carbs:
3.89 g
Water:
94.52 g
Other:
0.51 g
4
9%
65%
20%
6%
Protein:
8.58 g
Fats:
0.56 g
Carbs:
65.03 g
Water:
19.97 g
Other:
5.86 g
Contains
more
Water Water
+373.3%
Contains
more
Protein Protein
+875%
Contains
more
Fats Fats
+180%
Contains
more
Carbs Carbs
+1571.7%
Contains
more
Other Other
+1049%
Fat Type Comparison
Fat type breakdown side-by-side comparison
1
20%
22%
58%
Saturated fat:
Sat. Fat
0.028 g
Monounsaturated fat:
Mono. Fat
0.031 g
Polyunsaturated fat:
Poly. Fat
0.083 g
2
11%
26%
62%
Saturated fat:
Sat. Fat
0.045 g
Monounsaturated fat:
Mono. Fat
0.103 g
Polyunsaturated fat:
Poly. Fat
0.244 g
Contains
less
Sat. Fat Saturated fat
-37.8%
Contains
more
Mono. Fat Monounsaturated fat
+232.3%
Contains
more
Poly. Fat Polyunsaturated fat
+194%