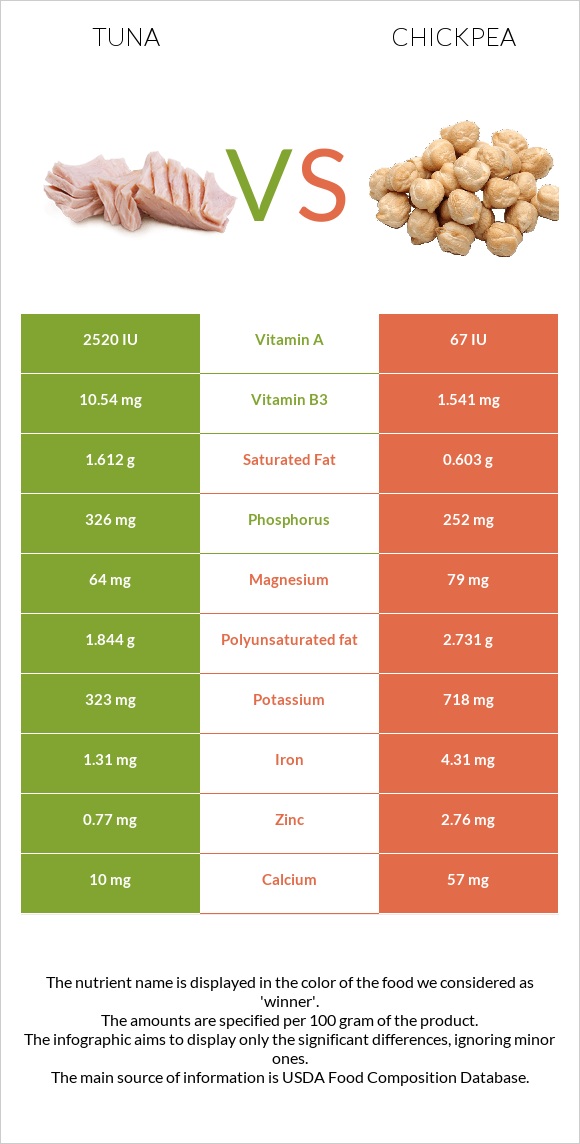
How are tuna and chickpeas different? Tuna is richer in selenium, vitamin B3, vitamin B12, vitamin B6, and phosphorus, while chickpeas are higher in manganese, folate, copper, fiber, and iron. Tuna covers your daily need for selenium, 190% more than chickpeas. Chickpeas have a higher glycemic index (36) than tuna (0). Fish, tuna, yellowfin, fresh, cooked, dry heat and Chickpeas (garbanzo beans, bengal gram), mature seeds, cooked, boiled, without salt types were used in this article.
Infographic
Mineral Comparison
Mineral comparison score is based on the number of minerals by which one or the other food is richer. The "coverage" charts below show how much of the daily needs can be covered by 300 grams of the food.
3
100 g
300 g
3 oz - 85g
Magnesium
Magnesium
Calcium
Calcium
Potassium
Potassium
Iron
Iron
Copper
Copper
Zinc
Zinc
Phosphorus
Phosphorus
Sodium
Sodium
Manganese
Manganese
Selenium
Selenium
30%
1.2%
47%
35%
14%
12%
143%
7%
1.7%
590%
7
100 g
300 g
1 cup - 164g
Magnesium
Magnesium
Calcium
Calcium
Potassium
Potassium
Iron
Iron
Copper
Copper
Zinc
Zinc
Phosphorus
Phosphorus
Sodium
Sodium
Manganese
Manganese
Selenium
Selenium
34%
15%
26%
108%
117%
42%
72%
0.91%
134%
20%
Vitamin Comparison
Vitamin comparison score is based on the number of vitamins by which one or the other food is richer. The "coverage" charts below show how much of the daily needs can be covered by 300 grams of the food.
8
100 g
300 g
3 oz - 85g
Vitamin C
Vit. C
Vitamin D
Vit. D
Vitamin A
Vit. A
Vitamin E
Vit. E
Vitamin B1
Vit. B1
Vitamin B2
Vit. B2
Vitamin B3
Vit. B3
Vitamin B5
Vit. B5
Vitamin B6
Vit. B6
Vitamin B12
Vit. B12
Vitamin K
Vit. K
Folate
Folate
0%
30%
7.3%
5.8%
34%
32%
414%
20%
240%
294%
0.25%
1.5%
4
100 g
300 g
1 cup - 164g
Vitamin C
Vit. C
Vitamin D
Vit. D
Vitamin A
Vit. A
Vitamin E
Vit. E
Vitamin B1
Vit. B1
Vitamin B2
Vit. B2
Vitamin B3
Vit. B3
Vitamin B5
Vit. B5
Vitamin B6
Vit. B6
Vitamin B12
Vit. B12
Vitamin K
Vit. K
Folate
Folate
4.3%
0%
0.33%
7%
29%
15%
9.9%
17%
32%
0%
10%
129%
All nutrients comparison - raw data values
Nutrient
DV% diff.
Selenium
108.2µg
3.7µg
190%
Vitamin B3
22.07mg
0.526mg
135%
Vitamin B12
2.35µg
0µg
98%
Vitamin B6
1.038mg
0.139mg
69%
Manganese
0.013mg
1.03mg
44%
Folate
2µg
172µg
43%
Protein
29.15g
8.86g
41%
Copper
0.043mg
0.352mg
34%
Fiber
0g
7.6g
30%
Iron
0.92mg
2.89mg
25%
Phosphorus
333mg
168mg
24%
Cholesterol
47mg
0mg
16%
Vitamin D*
82 IU
0 IU
10%
Vitamin D
2µg
0µg
10%
Zinc
0.45mg
1.53mg
10%
Carbs
0g
27.42g
9%
Potassium
527mg
291mg
7%
Polyunsaturated fat
0.175g
1.156g
7%
Vitamin B2
0.137mg
0.063mg
6%
Choline
77.6mg
42.8mg
6%
Calcium
4mg
49mg
5%
Fats
0.59g
2.59g
3%
Vitamin K
0.1µg
4µg
3%
Calories
130kcal
164kcal
2%
Sodium
54mg
7mg
2%
Vitamin A
22µg
1µg
2%
Vitamin B1
0.134mg
0.116mg
2%
Vitamin C
0mg
1.3mg
1%
Magnesium
42mg
48mg
1%
Vitamin B5
0.334mg
0.286mg
1%
Monounsaturated fat
0.138g
0.583g
1%
Protein per 100 calories
22g
5.4g
N/A
Calories per 10 g protein
45kcal
185kcal
N/A
Weight per 100 calories
77g
61g
N/A
Unsaturated / Saturated Fat ratio
1.5
6.5
N/A
Net carbs
0g
19.82g
N/A
Sugar
0g
4.8g
N/A
Vitamin E
0.29mg
0.35mg
0%
Trans fat
0.02g
0g
N/A
Saturated fat
0.205g
0.269g
0%
Tryptophan
0.313mg
0.085mg
0%
Threonine
1.224mg
0.329mg
0%
Isoleucine
1.287mg
0.38mg
0%
Leucine
2.27mg
0.631mg
0%
Lysine
2.565mg
0.593mg
0%
Methionine
0.827mg
0.116mg
0%
Phenylalanine
1.091mg
0.475mg
0%
Valine
1.438mg
0.372mg
0%
Histidine
0.822mg
0.244mg
0%
Omega-3 - EPA
0.015g
0g
N/A
Omega-3 - DHA
0.105g
0g
N/A
Omega-3 - DPA
0.005g
0g
N/A
Omega-6 - Eicosadienoic acid
0.002g
N/A
Macronutrient Comparison
Macronutrient breakdown side-by-side comparison
3
29%
69%
Protein:
29.15 g
Fats:
0.59 g
Carbs:
0 g
Water:
68.98 g
Other:
1.28 g
2
9%
3%
27%
60%
Protein:
8.86 g
Fats:
2.59 g
Carbs:
27.42 g
Water:
60.21 g
Other:
0.92 g
Contains
more
Protein Protein
+229%
Contains
more
Water Water
+14.6%
Contains
more
Other Other
+39.1%
Contains
more
Fats Fats
+339%
Contains
more
Carbs Carbs
+∞%
Fat Type Comparison
Fat type breakdown side-by-side comparison
1
40%
27%
34%
Saturated fat:
Sat. Fat
0.205 g
Monounsaturated fat:
Mono. Fat
0.138 g
Polyunsaturated fat:
Poly. Fat
0.175 g
2
13%
29%
58%
Saturated fat:
Sat. Fat
0.269 g
Monounsaturated fat:
Mono. Fat
0.583 g
Polyunsaturated fat:
Poly. Fat
1.156 g
Contains
less
Sat. Fat Saturated fat
-23.8%
Contains
more
Mono. Fat Monounsaturated fat
+322.5%
Contains
more
Poly. Fat Polyunsaturated fat
+560.6%