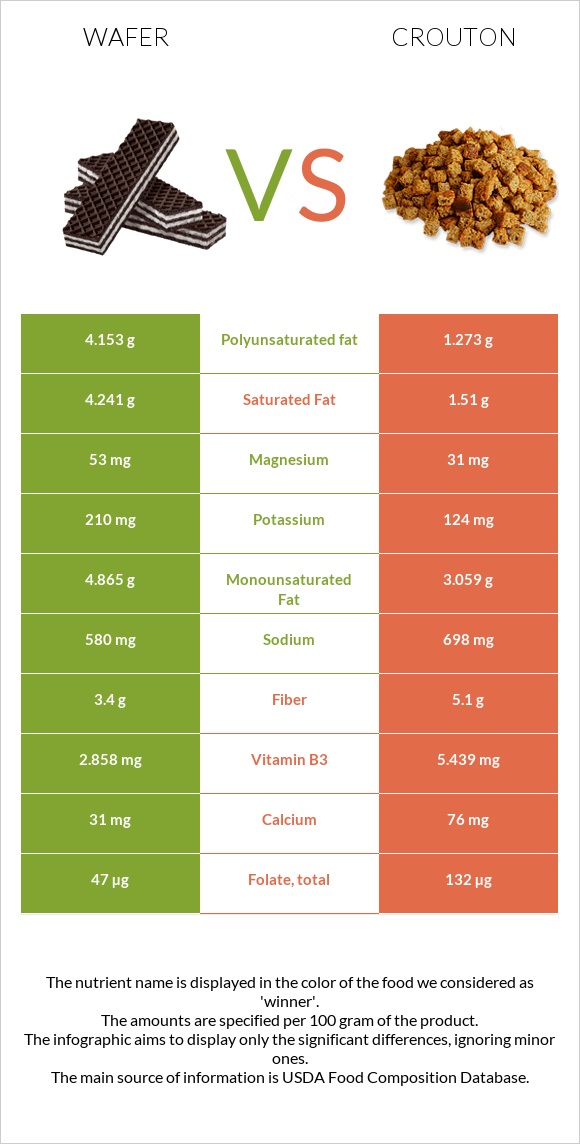
How are wafer and crouton different? Wafer is higher in copper, manganese, and magnesium; however, crouton is richer in selenium, vitamin B1, folate, vitamin B3, and fiber. Daily need coverage for selenium for crouton is 58% higher. Wafer contains 3 times more copper than crouton. While wafer contains 0.463mg of copper, crouton contains only 0.163mg. Crouton has less saturated fat. Wafer has a lower glycemic index (61) than crouton (72). Cookies, chocolate wafers and Croutons, plain are the varieties used in this article.
Infographic
Mineral Comparison
Mineral comparison score is based on the number of minerals by which one or the other food is richer. The "coverage" charts below show how much of the daily needs can be covered by 300 grams of the food.
7
100 g
300 g
1 wafer - 6g 1 oz - 28.35g 1 cup, crumbs - 112g
Magnesium
Magnesium
Calcium
Calcium
Potassium
Potassium
Iron
Iron
Copper
Copper
Zinc
Zinc
Phosphorus
Phosphorus
Sodium
Sodium
Manganese
Manganese
Selenium
Selenium
38%
9.3%
19%
150%
154%
30%
57%
76%
91%
31%
2
100 g
300 g
0.5 oz - 14.2g 1 cup - 30g
Magnesium
Magnesium
Calcium
Calcium
Potassium
Potassium
Iron
Iron
Copper
Copper
Zinc
Zinc
Phosphorus
Phosphorus
Sodium
Sodium
Manganese
Manganese
Selenium
Selenium
22%
23%
11%
153%
54%
24%
49%
91%
65%
205%
Vitamin Comparison
Vitamin comparison score is based on the number of vitamins by which one or the other food is richer. The "coverage" charts below show how much of the daily needs can be covered by 300 grams of the food.
5
100 g
300 g
1 wafer - 6g 1 oz - 28.35g 1 cup, crumbs - 112g
Vitamin C
Vit. C
Vitamin D
Vit. D
Vitamin A
Vit. A
Vitamin E
Vit. E
Vitamin B1
Vit. B1
Vitamin B2
Vit. B2
Vitamin B3
Vit. B3
Vitamin B5
Vit. B5
Vitamin B6
Vit. B6
Vitamin B12
Vit. B12
Vitamin K
Vit. K
Folate
Folate
0%
0%
1%
14%
51%
61%
54%
23%
12%
11%
6%
35%
4
100 g
300 g
0.5 oz - 14.2g 1 cup - 30g
Vitamin C
Vit. C
Vitamin D
Vit. D
Vitamin A
Vit. A
Vitamin E
Vit. E
Vitamin B1
Vit. B1
Vitamin B2
Vit. B2
Vitamin B3
Vit. B3
Vitamin B5
Vit. B5
Vitamin B6
Vit. B6
Vitamin B12
Vit. B12
Vitamin K
Vit. K
Folate
Folate
0%
0%
0%
0%
156%
63%
102%
26%
6%
0%
0%
99%
All nutrients comparison - raw data values
Nutrient
DV% diff.
Selenium
5.7µg
37.5µg
58%
Vitamin B1
0.203mg
0.623mg
35%
Copper
0.463mg
0.163mg
33%
Folate
47µg
132µg
21%
Polyunsaturated fat
4.153g
1.273g
19%
Vitamin B3
2.858mg
5.439mg
16%
Fats
14.2g
6.6g
12%
Saturated fat
4.241g
1.51g
12%
Protein
6.6g
11.9g
11%
Manganese
0.696mg
0.5mg
9%
Fiber
3.4g
5.1g
7%
Magnesium
53mg
31mg
5%
Calcium
31mg
76mg
5%
Sodium
580mg
698mg
5%
Vitamin E
0.72mg
5%
Monounsaturated fat
4.865g
3.059g
5%
Vitamin B12
0.09µg
0µg
4%
Potassium
210mg
124mg
3%
Choline
14.3mg
3%
Caffeine
10mg
3%
Zinc
1.09mg
0.89mg
2%
Phosphorus
132mg
115mg
2%
Vitamin B6
0.051mg
0.026mg
2%
Vitamin K
2.4µg
2%
Calories
433kcal
407kcal
1%
Cholesterol
2mg
0mg
1%
Iron
4.01mg
4.08mg
1%
Vitamin B5
0.381mg
0.429mg
1%
Protein per 100 calories
1.5g
2.9g
N/A
Calories per 10 g protein
656kcal
342kcal
N/A
Weight per 100 calories
23g
25g
N/A
Unsaturated / Saturated Fat ratio
2.1
2.9
N/A
Net carbs
69.3g
68.4g
N/A
Carbs
72.7g
73.5g
0%
Sugar
37.43g
N/A
Vitamin A
3µg
0µg
0%
Vitamin B2
0.266mg
0.272mg
0%
Tryptophan
0.096mg
0.14mg
0%
Threonine
0.22mg
0.337mg
0%
Isoleucine
0.261mg
0.456mg
0%
Leucine
0.447mg
0.832mg
0%
Lysine
0.281mg
0.278mg
0%
Methionine
0.105mg
0.211mg
0%
Phenylalanine
0.308mg
0.586mg
0%
Valine
0.323mg
0.514mg
0%
Histidine
0.128mg
0.255mg
0%
Omega-3 - EPA
0.003g
0g
N/A
Omega-3 - DHA
0.002g
0g
N/A
Macronutrient Comparison
Macronutrient breakdown side-by-side comparison
1
7%
14%
73%
5%
2%
Protein:
6.6 g
Fats:
14.2 g
Carbs:
72.7 g
Water:
4.5 g
Other:
2 g
4
12%
7%
74%
6%
3%
Protein:
11.9 g
Fats:
6.6 g
Carbs:
73.5 g
Water:
5.5 g
Other:
2.5 g
Contains
more
Fats Fats
+115.2%
Contains
more
Protein Protein
+80.3%
Contains
more
Water Water
+22.2%
Contains
more
Other Other
+25%
Fat Type Comparison
Fat type breakdown side-by-side comparison
2
32%
37%
31%
Saturated fat:
Sat. Fat
4.241 g
Monounsaturated fat:
Mono. Fat
4.865 g
Polyunsaturated fat:
Poly. Fat
4.153 g
1
26%
52%
22%
Saturated fat:
Sat. Fat
1.51 g
Monounsaturated fat:
Mono. Fat
3.059 g
Polyunsaturated fat:
Poly. Fat
1.273 g
Contains
more
Mono. Fat Monounsaturated fat
+59%
Contains
more
Poly. Fat Polyunsaturated fat
+226.2%
Contains
less
Sat. Fat Saturated fat
-64.4%