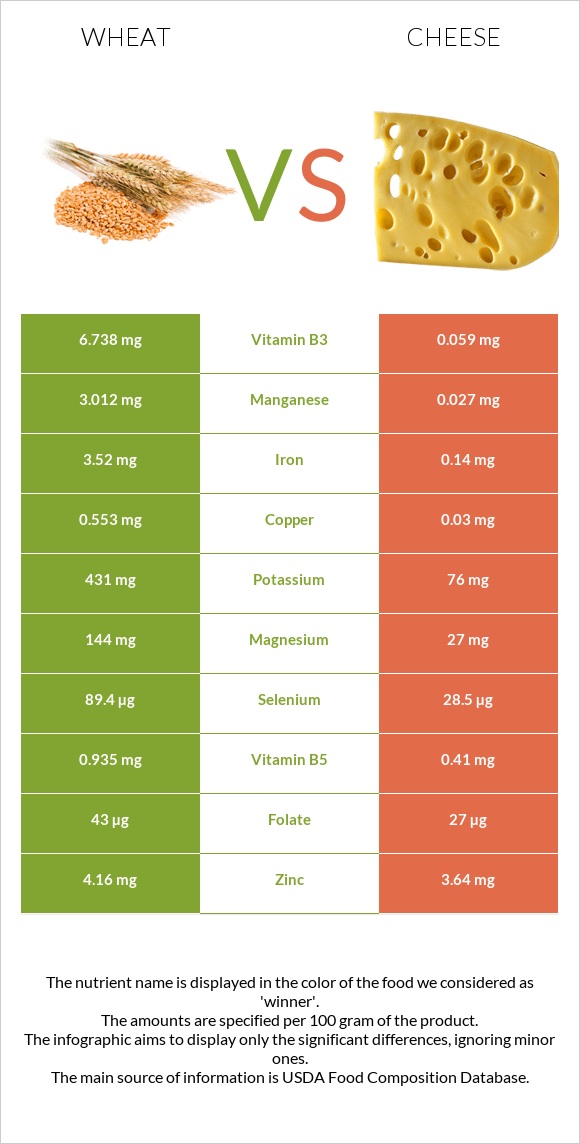
A recap on the differences between wheat and cheese Wheat is higher in manganese, selenium, copper, iron, vitamin B3, and vitamin B1, yet cheese is higher in calcium and vitamin B12. Wheat covers your daily manganese needs 130% more than cheese. Wheat contains 114 times more vitamin B3 than cheese. While wheat contains 6.738mg of vitamin B3, cheese contains only 0.059mg. The amount of saturated fat in wheat is lower. The glycemic index of cheese is lower. Food varieties used in this article are Wheat, durum and Cheese, cheddar .
Infographic
Mineral Comparison
Mineral comparison score is based on the number of minerals by which one or the other food is richer. The "coverage" charts below show how much of the daily needs can be covered by 300 grams of the food.
9
100 g
300 g
1 cup - 192g
Magnesium
Magnesium
Calcium
Calcium
Potassium
Potassium
Iron
Iron
Copper
Copper
Zinc
Zinc
Phosphorus
Phosphorus
Sodium
Sodium
Manganese
Manganese
Selenium
Selenium
103%
10%
38%
132%
184%
113%
218%
0.26%
393%
488%
1
100 g
300 g
1 cubic inch - 17g 1 slice (1 oz) - 28g 1 oz - 28.35g 1 cup, shredded - 113g 1 cup, diced - 132g 1 cup, melted - 244g
Magnesium
Magnesium
Calcium
Calcium
Potassium
Potassium
Iron
Iron
Copper
Copper
Zinc
Zinc
Phosphorus
Phosphorus
Sodium
Sodium
Manganese
Manganese
Selenium
Selenium
19%
213%
6.7%
5.3%
10%
99%
195%
85%
3.5%
155%
Vitamin Comparison
Vitamin comparison score is based on the number of vitamins by which one or the other food is richer. The "coverage" charts below show how much of the daily needs can be covered by 300 grams of the food.
5
100 g
300 g
1 cup - 192g
Vitamin C
Vit. C
Vitamin D
Vit. D
Vitamin A
Vit. A
Vitamin E
Vit. E
Vitamin B1
Vit. B1
Vitamin B2
Vit. B2
Vitamin B3
Vit. B3
Vitamin B5
Vit. B5
Vitamin B6
Vit. B6
Vitamin B12
Vit. B12
Vitamin K
Vit. K
Folate
Folate
0%
0%
0%
0%
105%
28%
126%
56%
97%
0%
0%
32%
6
100 g
300 g
1 cubic inch - 17g 1 slice (1 oz) - 28g 1 oz - 28.35g 1 cup, shredded - 113g 1 cup, diced - 132g 1 cup, melted - 244g
Vitamin C
Vit. C
Vitamin D
Vit. D
Vitamin A
Vit. A
Vitamin E
Vit. E
Vitamin B1
Vit. B1
Vitamin B2
Vit. B2
Vitamin B3
Vit. B3
Vitamin B5
Vit. B5
Vitamin B6
Vit. B6
Vitamin B12
Vit. B12
Vitamin K
Vit. K
Folate
Folate
0%
9%
110%
14%
7.3%
99%
1.1%
25%
15%
138%
6%
20%
All nutrients comparison - raw data values
Nutrient
DV% diff.
Manganese
3.012mg
0.027mg
130%
Selenium
89.4µg
28.5µg
111%
Saturated fat
0.454g
18.867g
84%
Calcium
34mg
710mg
68%
Copper
0.553mg
0.03mg
58%
Fats
2.47g
33.31g
47%
Vitamin B12
0µg
1.1µg
46%
Iron
3.52mg
0.14mg
42%
Vitamin B3
6.738mg
0.059mg
42%
Vitamin A
0µg
330µg
37%
Cholesterol
0mg
99mg
33%
Vitamin B1
0.419mg
0.029mg
33%
Magnesium
144mg
27mg
28%
Sodium
2mg
653mg
28%
Vitamin B6
0.419mg
0.066mg
27%
Vitamin B2
0.121mg
0.428mg
24%
Carbs
71.13g
3.09g
23%
Monounsaturated fat
0.344g
9.246g
22%
Protein
13.68g
22.87g
18%
Vitamin B5
0.935mg
0.41mg
11%
Potassium
431mg
76mg
10%
Phosphorus
508mg
455mg
8%
Zinc
4.16mg
3.64mg
5%
Vitamin E
0.71mg
5%
Folate
43µg
27µg
4%
Calories
339kcal
404kcal
3%
Vitamin D*
0 IU
24 IU
3%
Vitamin D
0µg
0.6µg
3%
Choline
16.5mg
3%
Polyunsaturated fat
0.978g
1.421g
3%
Vitamin K
2.4µg
2%
Protein per 100 calories
4g
5.7g
N/A
Calories per 10 g protein
248kcal
177kcal
N/A
Weight per 100 calories
29g
25g
N/A
Unsaturated / Saturated Fat ratio
2.9
0.57
N/A
Net carbs
71.13g
3.09g
N/A
Sugar
0.48g
N/A
Trans fat
0.917g
N/A
Tryptophan
0.176mg
0.547mg
0%
Threonine
0.366mg
1.044mg
0%
Isoleucine
0.533mg
1.206mg
0%
Leucine
0.934mg
1.939mg
0%
Lysine
0.303mg
1.025mg
0%
Methionine
0.221mg
0.547mg
0%
Phenylalanine
0.681mg
1.074mg
0%
Valine
0.594mg
1.404mg
0%
Histidine
0.322mg
0.547mg
0%
Omega-3 - EPA
0.01g
N/A
Omega-3 - DHA
0.001g
N/A
Omega-3 - DPA
0.017g
N/A
Omega-6 - Eicosadienoic acid
0.007g
N/A
Macronutrient Comparison
Macronutrient breakdown side-by-side comparison
1
14%
2%
71%
11%
2%
Protein:
13.68 g
Fats:
2.47 g
Carbs:
71.13 g
Water:
10.94 g
Other:
1.78 g
4
23%
33%
3%
37%
4%
Protein:
22.87 g
Fats:
33.31 g
Carbs:
3.09 g
Water:
37.02 g
Other:
3.71 g
Contains
more
Carbs Carbs
+2201.9%
Contains
more
Protein Protein
+67.2%
Contains
more
Fats Fats
+1248.6%
Contains
more
Water Water
+238.4%
Contains
more
Other Other
+108.4%
Fat Type Comparison
Fat type breakdown side-by-side comparison
1
26%
19%
55%
Saturated fat:
Sat. Fat
0.454 g
Monounsaturated fat:
Mono. Fat
0.344 g
Polyunsaturated fat:
Poly. Fat
0.978 g
2
64%
31%
5%
Saturated fat:
Sat. Fat
18.867 g
Monounsaturated fat:
Mono. Fat
9.246 g
Polyunsaturated fat:
Poly. Fat
1.421 g
Contains
less
Sat. Fat Saturated fat
-97.6%
Contains
more
Mono. Fat Monounsaturated fat
+2587.8%
Contains
more
Poly. Fat Polyunsaturated fat
+45.3%