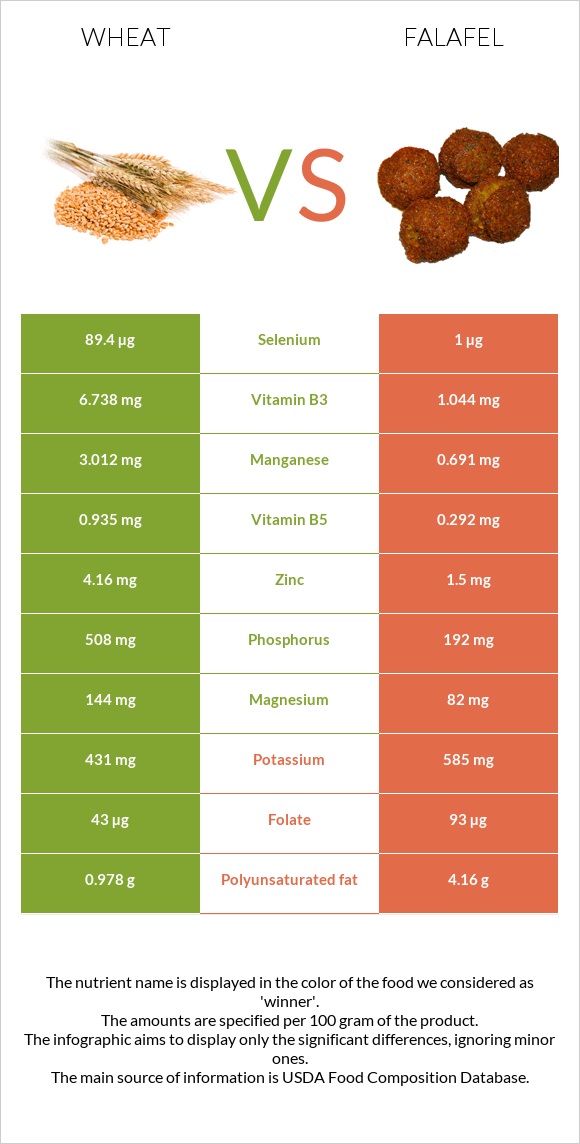
The main differences between wheat and falafel Wheat is richer than falafel in selenium, manganese, phosphorus, vitamin B3, copper, zinc, vitamin B1, vitamin B6, magnesium, and vitamin B5. Daily need coverage for selenium for wheat is 161% higher. Wheat contains 6 times more vitamin B3 than falafel. Wheat contains 6.738mg of vitamin B3, while falafel contains 1.044mg. Falafel has a lower glycemic index than wheat . Food types used in this article are Wheat, durum and Falafel, home-prepared .
Infographic
Mineral Comparison
Mineral comparison score is based on the number of minerals by which one or the other food is richer. The "coverage" charts below show how much of the daily needs can be covered by 300 grams of the food.
7
100 g
300 g
1 cup - 192g
Magnesium
Magnesium
Calcium
Calcium
Potassium
Potassium
Iron
Iron
Copper
Copper
Zinc
Zinc
Phosphorus
Phosphorus
Sodium
Sodium
Manganese
Manganese
Selenium
Selenium
103%
10%
38%
132%
184%
113%
218%
0.26%
393%
488%
2
100 g
300 g
1 patty (approx 2-1/4" dia) - 17g
Magnesium
Magnesium
Calcium
Calcium
Potassium
Potassium
Iron
Iron
Copper
Copper
Zinc
Zinc
Phosphorus
Phosphorus
Sodium
Sodium
Manganese
Manganese
Selenium
Selenium
59%
16%
52%
128%
86%
41%
82%
38%
90%
5.5%
Vitamin Comparison
Vitamin comparison score is based on the number of vitamins by which one or the other food is richer. The "coverage" charts below show how much of the daily needs can be covered by 300 grams of the food.
4
100 g
300 g
1 cup - 192g
Vitamin C
Vit. C
Vitamin D
Vit. D
Vitamin A
Vit. A
Vitamin E
Vit. E
Vitamin B1
Vit. B1
Vitamin B2
Vit. B2
Vitamin B3
Vit. B3
Vitamin B5
Vit. B5
Vitamin B6
Vit. B6
Vitamin B12
Vit. B12
Vitamin K
Vit. K
Folate
Folate
0%
0%
0%
0%
105%
28%
126%
56%
97%
0%
0%
32%
4
100 g
300 g
1 patty (approx 2-1/4" dia) - 17g
Vitamin C
Vit. C
Vitamin D
Vit. D
Vitamin A
Vit. A
Vitamin E
Vit. E
Vitamin B1
Vit. B1
Vitamin B2
Vit. B2
Vitamin B3
Vit. B3
Vitamin B5
Vit. B5
Vitamin B6
Vit. B6
Vitamin B12
Vit. B12
Vitamin K
Vit. K
Folate
Folate
5.3%
0%
0.33%
0%
37%
38%
20%
18%
29%
0%
0%
70%
All nutrients comparison - raw data values
Nutrient
DV% diff.
Selenium
89.4µg
1µg
161%
Manganese
3.012mg
0.691mg
101%
Phosphorus
508mg
192mg
45%
Vitamin B3
6.738mg
1.044mg
36%
Copper
0.553mg
0.258mg
33%
Monounsaturated fat
0.344g
10.171g
25%
Fats
2.47g
17.8g
24%
Zinc
4.16mg
1.5mg
24%
Vitamin B1
0.419mg
0.146mg
23%
Vitamin B6
0.419mg
0.125mg
23%
Polyunsaturated fat
0.978g
4.16g
21%
Magnesium
144mg
82mg
15%
Carbs
71.13g
31.84g
13%
Sodium
2mg
294mg
13%
Vitamin B5
0.935mg
0.292mg
13%
Folate
43µg
93µg
13%
Saturated fat
0.454g
2.383g
9%
Potassium
431mg
585mg
5%
Vitamin B2
0.121mg
0.166mg
3%
Vitamin C
0mg
1.6mg
2%
Calcium
34mg
54mg
2%
Protein
13.68g
13.31g
1%
Iron
3.52mg
3.42mg
1%
Calories
339kcal
333kcal
0%
Protein per 100 calories
4g
4g
N/A
Calories per 10 g protein
248kcal
250kcal
N/A
Weight per 100 calories
29g
30g
N/A
Unsaturated / Saturated Fat ratio
2.9
6
N/A
Net carbs
71.13g
31.84g
N/A
Vitamin A
0µg
1µg
0%
Tryptophan
0.176mg
0.134mg
0%
Threonine
0.366mg
0.492mg
0%
Isoleucine
0.533mg
0.567mg
0%
Leucine
0.934mg
0.944mg
0%
Lysine
0.303mg
0.856mg
0%
Methionine
0.221mg
0.187mg
0%
Phenylalanine
0.681mg
0.707mg
0%
Valine
0.594mg
0.562mg
0%
Histidine
0.322mg
0.364mg
0%
Macronutrient Comparison
Macronutrient breakdown side-by-side comparison
2
14%
2%
71%
11%
2%
Protein:
13.68 g
Fats:
2.47 g
Carbs:
71.13 g
Water:
10.94 g
Other:
1.78 g
3
13%
18%
32%
35%
2%
Protein:
13.31 g
Fats:
17.8 g
Carbs:
31.84 g
Water:
34.62 g
Other:
2.43 g
Contains
more
Carbs Carbs
+123.4%
Contains
more
Fats Fats
+620.6%
Contains
more
Water Water
+216.5%
Contains
more
Other Other
+36.5%
~equal in
Protein
~13.31g
Fat Type Comparison
Fat type breakdown side-by-side comparison
1
26%
19%
55%
Saturated fat:
Sat. Fat
0.454 g
Monounsaturated fat:
Mono. Fat
0.344 g
Polyunsaturated fat:
Poly. Fat
0.978 g
2
14%
61%
25%
Saturated fat:
Sat. Fat
2.383 g
Monounsaturated fat:
Mono. Fat
10.171 g
Polyunsaturated fat:
Poly. Fat
4.16 g
Contains
less
Sat. Fat Saturated fat
-80.9%
Contains
more
Mono. Fat Monounsaturated fat
+2856.7%
Contains
more
Poly. Fat Polyunsaturated fat
+325.4%