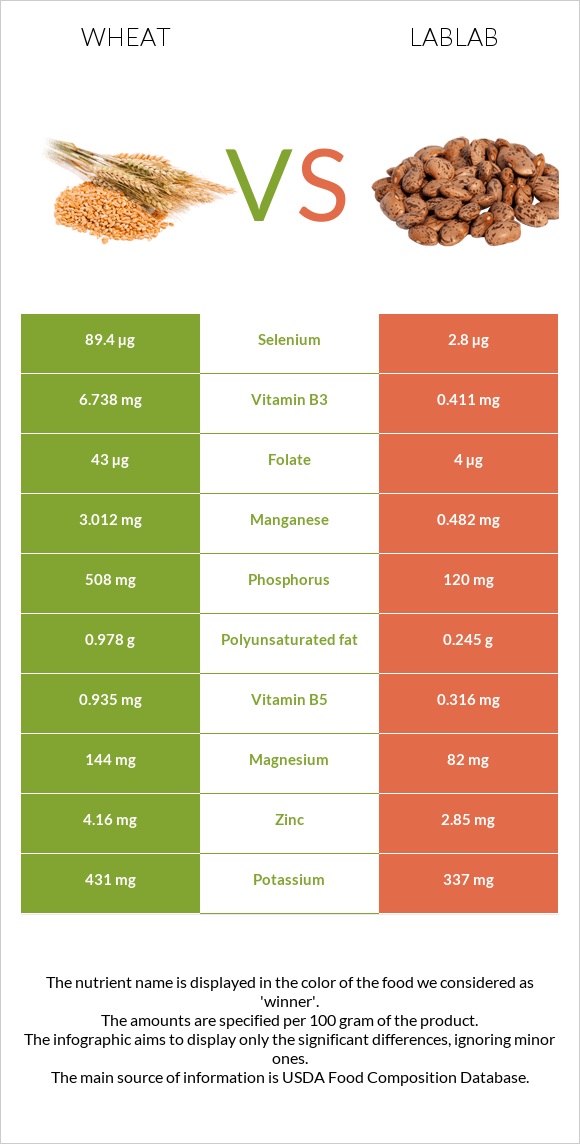
The main differences between wheat and lablab Wheat is richer in selenium, manganese, phosphorus, vitamin B3, vitamin B6, copper, magnesium, vitamin B1, and vitamin B5, yet lablab is richer in iron. Daily need coverage for selenium for wheat is 157% higher. Wheat contains 16 times more vitamin B3 than lablab. Wheat contains 6.738mg of vitamin B3, while lablab contains 0.411mg. Food types used in this article are Wheat, durum and Hyacinth beans, mature seeds, cooked, boiled, without salt .
Infographic
Mineral Comparison
Mineral comparison score is based on the number of minerals by which one or the other food is richer. The "coverage" charts below show how much of the daily needs can be covered by 300 grams of the food.
8
100 g
300 g
1 cup - 192g
Magnesium
Magnesium
Calcium
Calcium
Potassium
Potassium
Iron
Iron
Copper
Copper
Zinc
Zinc
Phosphorus
Phosphorus
Sodium
Sodium
Manganese
Manganese
Selenium
Selenium
103%
10%
38%
132%
184%
113%
218%
0.26%
393%
488%
2
100 g
300 g
1 cup - 194g
Magnesium
Magnesium
Calcium
Calcium
Potassium
Potassium
Iron
Iron
Copper
Copper
Zinc
Zinc
Phosphorus
Phosphorus
Sodium
Sodium
Manganese
Manganese
Selenium
Selenium
59%
12%
30%
172%
114%
78%
51%
0.91%
63%
15%
Vitamin Comparison
Vitamin comparison score is based on the number of vitamins by which one or the other food is richer. The "coverage" charts below show how much of the daily needs can be covered by 300 grams of the food.
6
100 g
300 g
1 cup - 192g
Vitamin C
Vit. C
Vitamin D
Vit. D
Vitamin A
Vit. A
Vitamin E
Vit. E
Vitamin B1
Vit. B1
Vitamin B2
Vit. B2
Vitamin B3
Vit. B3
Vitamin B5
Vit. B5
Vitamin B6
Vit. B6
Vitamin B12
Vit. B12
Vitamin K
Vit. K
Folate
Folate
0%
0%
0%
0%
105%
28%
126%
56%
97%
0%
0%
32%
0
100 g
300 g
1 cup - 194g
Vitamin C
Vit. C
Vitamin D
Vit. D
Vitamin A
Vit. A
Vitamin E
Vit. E
Vitamin B1
Vit. B1
Vitamin B2
Vit. B2
Vitamin B3
Vit. B3
Vitamin B5
Vit. B5
Vitamin B6
Vit. B6
Vitamin B12
Vit. B12
Vitamin K
Vit. K
Folate
Folate
0%
0%
0%
0%
68%
8.5%
7.7%
19%
8.5%
0%
0%
3%
All nutrients comparison - raw data values
Nutrient
DV% diff.
Selenium
89.4µg
2.8µg
157%
Manganese
3.012mg
0.482mg
110%
Phosphorus
508mg
120mg
55%
Vitamin B3
6.738mg
0.411mg
40%
Vitamin B6
0.419mg
0.037mg
29%
Copper
0.553mg
0.341mg
24%
Carbs
71.13g
20.69g
17%
Magnesium
144mg
82mg
15%
Iron
3.52mg
4.58mg
13%
Zinc
4.16mg
2.85mg
12%
Vitamin B1
0.419mg
0.27mg
12%
Vitamin B5
0.935mg
0.316mg
12%
Calories
339kcal
117kcal
11%
Protein
13.68g
8.14g
11%
Folate
43µg
4µg
10%
Vitamin B2
0.121mg
0.037mg
6%
Polyunsaturated fat
0.978g
0.245g
5%
Fats
2.47g
0.58g
3%
Potassium
431mg
337mg
3%
Saturated fat
0.454g
0.099g
2%
Calcium
34mg
40mg
1%
Monounsaturated fat
0.344g
0.026g
1%
Protein per 100 calories
4g
7g
N/A
Calories per 10 g protein
248kcal
144kcal
N/A
Weight per 100 calories
29g
85g
N/A
Unsaturated / Saturated Fat ratio
2.9
2.7
N/A
Net carbs
71.13g
20.69g
N/A
Sodium
2mg
7mg
0%
Tryptophan
0.176mg
0.068mg
0%
Threonine
0.366mg
0.315mg
0%
Isoleucine
0.533mg
0.39mg
0%
Leucine
0.934mg
0.691mg
0%
Lysine
0.303mg
0.556mg
0%
Methionine
0.221mg
0.065mg
0%
Phenylalanine
0.681mg
0.41mg
0%
Valine
0.594mg
0.422mg
0%
Histidine
0.322mg
0.233mg
0%
Macronutrient Comparison
Macronutrient breakdown side-by-side comparison
4
14%
2%
71%
11%
2%
Protein:
13.68 g
Fats:
2.47 g
Carbs:
71.13 g
Water:
10.94 g
Other:
1.78 g
1
8%
21%
69%
Protein:
8.14 g
Fats:
0.58 g
Carbs:
20.69 g
Water:
69.13 g
Other:
1.46 g
Contains
more
Protein Protein
+68.1%
Contains
more
Fats Fats
+325.9%
Contains
more
Carbs Carbs
+243.8%
Contains
more
Other Other
+21.9%
Contains
more
Water Water
+531.9%
Fat Type Comparison
Fat type breakdown side-by-side comparison
2
26%
19%
55%
Saturated fat:
Sat. Fat
0.454 g
Monounsaturated fat:
Mono. Fat
0.344 g
Polyunsaturated fat:
Poly. Fat
0.978 g
1
27%
7%
66%
Saturated fat:
Sat. Fat
0.099 g
Monounsaturated fat:
Mono. Fat
0.026 g
Polyunsaturated fat:
Poly. Fat
0.245 g
Contains
more
Mono. Fat Monounsaturated fat
+1223.1%
Contains
more
Poly. Fat Polyunsaturated fat
+299.2%
Contains
less
Sat. Fat Saturated fat
-78.2%