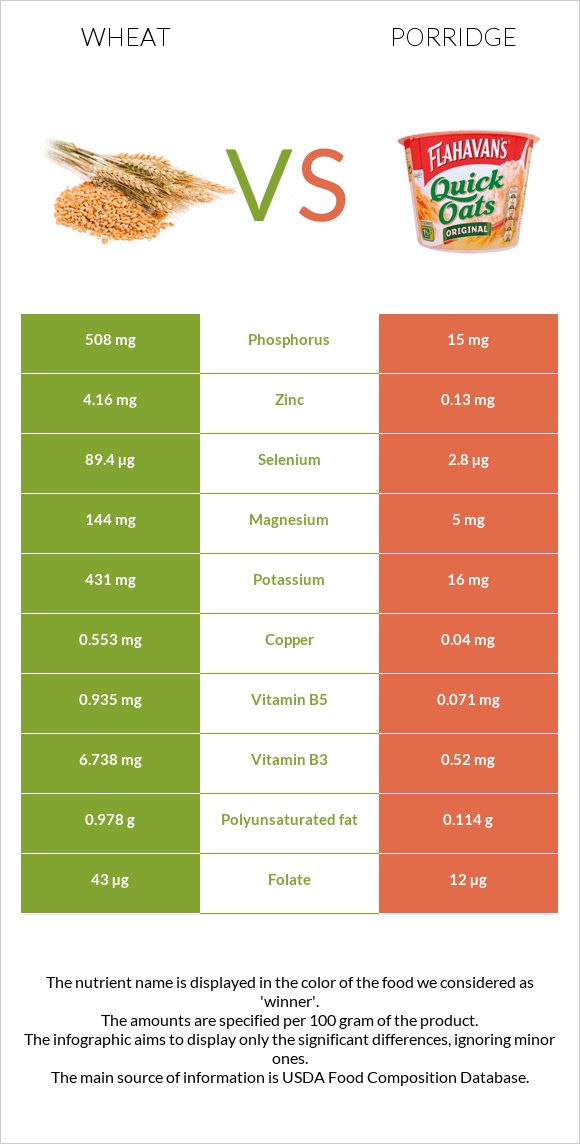
How are wheat and porridge different? Wheat has more selenium, manganese, phosphorus, copper, vitamin B3, zinc, magnesium, vitamin B6, vitamin B1, and vitamin B5 than porridge. Daily need coverage for selenium for wheat is 157% higher. Wheat has a lower glycemic index (50) than porridge (66). Wheat, durum and Cereals, CREAM OF WHEAT, regular (10 minute), cooked with water, without salt are the varieties used in this article.
Infographic
Mineral Comparison
Mineral comparison score is based on the number of minerals by which one or the other food is richer. The "coverage" charts below show how much of the daily needs can be covered by 300 grams of the food.
8
100 g
300 g
1 cup - 192g
Magnesium
Magnesium
Calcium
Calcium
Potassium
Potassium
Iron
Iron
Copper
Copper
Zinc
Zinc
Phosphorus
Phosphorus
Sodium
Sodium
Manganese
Manganese
Selenium
Selenium
103%
10%
38%
132%
184%
113%
218%
0.26%
393%
488%
1
100 g
300 g
1 tbsp - 16g 1 cup (1 serving) - 251g
Magnesium
Magnesium
Calcium
Calcium
Potassium
Potassium
Iron
Iron
Copper
Copper
Zinc
Zinc
Phosphorus
Phosphorus
Sodium
Sodium
Manganese
Manganese
Selenium
Selenium
3.6%
26%
1.4%
140%
13%
3.5%
6.4%
0.78%
0%
15%
Vitamin Comparison
Vitamin comparison score is based on the number of vitamins by which one or the other food is richer. The "coverage" charts below show how much of the daily needs can be covered by 300 grams of the food.
6
100 g
300 g
1 cup - 192g
Vitamin C
Vit. C
Vitamin D
Vit. D
Vitamin A
Vit. A
Vitamin E
Vit. E
Vitamin B1
Vit. B1
Vitamin B2
Vit. B2
Vitamin B3
Vit. B3
Vitamin B5
Vit. B5
Vitamin B6
Vit. B6
Vitamin B12
Vit. B12
Vitamin K
Vit. K
Folate
Folate
0%
0%
0%
0%
105%
28%
126%
56%
97%
0%
0%
32%
2
100 g
300 g
1 tbsp - 16g 1 cup (1 serving) - 251g
Vitamin C
Vit. C
Vitamin D
Vit. D
Vitamin A
Vit. A
Vitamin E
Vit. E
Vitamin B1
Vit. B1
Vitamin B2
Vit. B2
Vitamin B3
Vit. B3
Vitamin B5
Vit. B5
Vitamin B6
Vit. B6
Vitamin B12
Vit. B12
Vitamin K
Vit. K
Folate
Folate
0%
0%
0%
0.4%
14%
5.8%
9.8%
4.3%
3%
0%
0.25%
9%
All nutrients comparison - raw data values
Nutrient
DV% diff.
Selenium
89.4µg
2.8µg
157%
Manganese
3.012mg
0mg
131%
Phosphorus
508mg
15mg
70%
Copper
0.553mg
0.04mg
57%
Vitamin B3
6.738mg
0.52mg
39%
Zinc
4.16mg
0.13mg
37%
Magnesium
144mg
5mg
33%
Vitamin B6
0.419mg
0.013mg
31%
Vitamin B1
0.419mg
0.055mg
30%
Protein
13.68g
1.44g
24%
Carbs
71.13g
10.52g
20%
Vitamin B5
0.935mg
0.071mg
17%
Calories
339kcal
50kcal
14%
Potassium
431mg
16mg
12%
Folate
43µg
12µg
8%
Vitamin B2
0.121mg
0.025mg
7%
Polyunsaturated fat
0.978g
0.114g
6%
Calcium
34mg
87mg
5%
Fats
2.47g
0.21g
3%
Iron
3.52mg
3.74mg
3%
Fiber
0.5g
2%
Saturated fat
0.454g
0.033g
2%
Monounsaturated fat
0.344g
0.028g
1%
Protein per 100 calories
4g
2.9g
N/A
Calories per 10 g protein
248kcal
347kcal
N/A
Weight per 100 calories
29g
200g
N/A
Unsaturated / Saturated Fat ratio
2.9
4.3
N/A
Net carbs
71.13g
10.02g
N/A
Sugar
0.03g
N/A
Sodium
2mg
6mg
0%
Vitamin E
0.02mg
0%
Vitamin K
0.1µg
0%
Tryptophan
0.176mg
0.02mg
0%
Threonine
0.366mg
0.045mg
0%
Isoleucine
0.533mg
0.063mg
0%
Leucine
0.934mg
0.11mg
0%
Lysine
0.303mg
0.037mg
0%
Methionine
0.221mg
0.027mg
0%
Phenylalanine
0.681mg
0.078mg
0%
Valine
0.594mg
0.07mg
0%
Histidine
0.322mg
0.033mg
0%
Macronutrient Comparison
Macronutrient breakdown side-by-side comparison
4
14%
2%
71%
11%
2%
Protein:
13.68 g
Fats:
2.47 g
Carbs:
71.13 g
Water:
10.94 g
Other:
1.78 g
1
11%
88%
Protein:
1.44 g
Fats:
0.21 g
Carbs:
10.52 g
Water:
87.61 g
Other:
0.22 g
Contains
more
Protein Protein
+850%
Contains
more
Fats Fats
+1076.2%
Contains
more
Carbs Carbs
+576.1%
Contains
more
Other Other
+709.1%
Contains
more
Water Water
+700.8%
Fat Type Comparison
Fat type breakdown side-by-side comparison
2
26%
19%
55%
Saturated fat:
Sat. Fat
0.454 g
Monounsaturated fat:
Mono. Fat
0.344 g
Polyunsaturated fat:
Poly. Fat
0.978 g
1
19%
16%
65%
Saturated fat:
Sat. Fat
0.033 g
Monounsaturated fat:
Mono. Fat
0.028 g
Polyunsaturated fat:
Poly. Fat
0.114 g
Contains
more
Mono. Fat Monounsaturated fat
+1128.6%
Contains
more
Poly. Fat Polyunsaturated fat
+757.9%
Contains
less
Sat. Fat Saturated fat
-92.7%