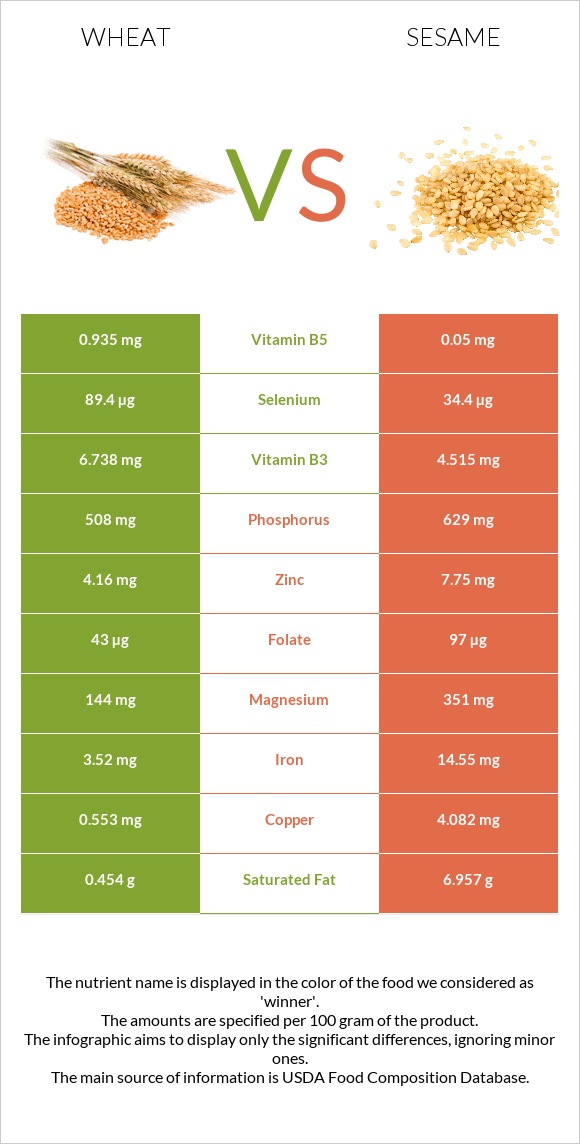
How are wheat and sesame different? Wheat is higher in selenium and manganese; however, sesame is richer in copper, iron, calcium, magnesium, zinc, vitamin B1, and vitamin B6. Daily need coverage for copper for sesame is 392% higher. Wheat contains 3 times more selenium than sesame. While wheat contains 89.4µg of selenium, sesame contains only 34.4µg. Wheat has less saturated fat. Wheat, durum and Seeds, sesame seeds, whole, dried are the varieties used in this article.
Infographic
Mineral Comparison
Mineral comparison score is based on the number of minerals by which one or the other food is richer. The "coverage" charts below show how much of the daily needs can be covered by 300 grams of the food.
3
100 g
300 g
1 cup - 192g
Magnesium
Magnesium
Calcium
Calcium
Potassium
Potassium
Iron
Iron
Copper
Copper
Zinc
Zinc
Phosphorus
Phosphorus
Sodium
Sodium
Manganese
Manganese
Selenium
Selenium
103%
10%
38%
132%
184%
113%
218%
0.26%
393%
488%
6
100 g
300 g
1 tbsp - 9g 1 cup - 144g
Magnesium
Magnesium
Calcium
Calcium
Potassium
Potassium
Iron
Iron
Copper
Copper
Zinc
Zinc
Phosphorus
Phosphorus
Sodium
Sodium
Manganese
Manganese
Selenium
Selenium
251%
293%
41%
546%
1361%
211%
270%
1.4%
321%
188%
Vitamin Comparison
Vitamin comparison score is based on the number of vitamins by which one or the other food is richer. The "coverage" charts below show how much of the daily needs can be covered by 300 grams of the food.
2
100 g
300 g
1 cup - 192g
Vitamin C
Vit. C
Vitamin D
Vit. D
Vitamin A
Vit. A
Vitamin E
Vit. E
Vitamin B1
Vit. B1
Vitamin B2
Vit. B2
Vitamin B3
Vit. B3
Vitamin B5
Vit. B5
Vitamin B6
Vit. B6
Vitamin B12
Vit. B12
Vitamin K
Vit. K
Folate
Folate
0%
0%
0%
0%
105%
28%
126%
56%
97%
0%
0%
32%
5
100 g
300 g
1 tbsp - 9g 1 cup - 144g
Vitamin C
Vit. C
Vitamin D
Vit. D
Vitamin A
Vit. A
Vitamin E
Vit. E
Vitamin B1
Vit. B1
Vitamin B2
Vit. B2
Vitamin B3
Vit. B3
Vitamin B5
Vit. B5
Vitamin B6
Vit. B6
Vitamin B12
Vit. B12
Vitamin K
Vit. K
Folate
Folate
0%
0%
0%
5%
198%
57%
85%
3%
182%
0%
0%
73%
All nutrients comparison - raw data values
Nutrient
DV% diff.
Copper
0.553mg
4.082mg
392%
Polyunsaturated fat
0.978g
21.773g
139%
Iron
3.52mg
14.55mg
138%
Selenium
89.4µg
34.4µg
100%
Calcium
34mg
975mg
94%
Fats
2.47g
49.67g
73%
Magnesium
144mg
351mg
49%
Fiber
11.8g
47%
Monounsaturated fat
0.344g
18.759g
46%
Zinc
4.16mg
7.75mg
33%
Vitamin B1
0.419mg
0.791mg
31%
Saturated fat
0.454g
6.957g
30%
Vitamin B6
0.419mg
0.79mg
29%
Manganese
3.012mg
2.46mg
24%
Vitamin B5
0.935mg
0.05mg
18%
Phosphorus
508mg
629mg
17%
Carbs
71.13g
23.45g
16%
Vitamin B3
6.738mg
4.515mg
14%
Folate
43µg
97µg
14%
Calories
339kcal
573kcal
12%
Vitamin B2
0.121mg
0.247mg
10%
Protein
13.68g
17.73g
8%
Choline
25.6mg
5%
Vitamin E
0.25mg
2%
Potassium
431mg
468mg
1%
Protein per 100 calories
4g
3.1g
N/A
Calories per 10 g protein
248kcal
323kcal
N/A
Weight per 100 calories
29g
17g
N/A
Unsaturated / Saturated Fat ratio
2.9
5.8
N/A
Net carbs
71.13g
11.65g
N/A
Sugar
0.3g
N/A
Sodium
2mg
11mg
0%
Tryptophan
0.176mg
0.388mg
0%
Threonine
0.366mg
0.736mg
0%
Isoleucine
0.533mg
0.763mg
0%
Leucine
0.934mg
1.358mg
0%
Lysine
0.303mg
0.569mg
0%
Methionine
0.221mg
0.586mg
0%
Phenylalanine
0.681mg
0.94mg
0%
Valine
0.594mg
0.99mg
0%
Histidine
0.322mg
0.522mg
0%
Macronutrient Comparison
Macronutrient breakdown side-by-side comparison
2
14%
2%
71%
11%
2%
Protein:
13.68 g
Fats:
2.47 g
Carbs:
71.13 g
Water:
10.94 g
Other:
1.78 g
3
18%
50%
23%
5%
4%
Protein:
17.73 g
Fats:
49.67 g
Carbs:
23.45 g
Water:
4.69 g
Other:
4.46 g
Contains
more
Carbs Carbs
+203.3%
Contains
more
Water Water
+133.3%
Contains
more
Protein Protein
+29.6%
Contains
more
Fats Fats
+1910.9%
Contains
more
Other Other
+150.6%
Fat Type Comparison
Fat type breakdown side-by-side comparison
1
26%
19%
55%
Saturated fat:
Sat. Fat
0.454 g
Monounsaturated fat:
Mono. Fat
0.344 g
Polyunsaturated fat:
Poly. Fat
0.978 g
2
15%
40%
46%
Saturated fat:
Sat. Fat
6.957 g
Monounsaturated fat:
Mono. Fat
18.759 g
Polyunsaturated fat:
Poly. Fat
21.773 g
Contains
less
Sat. Fat Saturated fat
-93.5%
Contains
more
Mono. Fat Monounsaturated fat
+5353.2%
Contains
more
Poly. Fat Polyunsaturated fat
+2126.3%