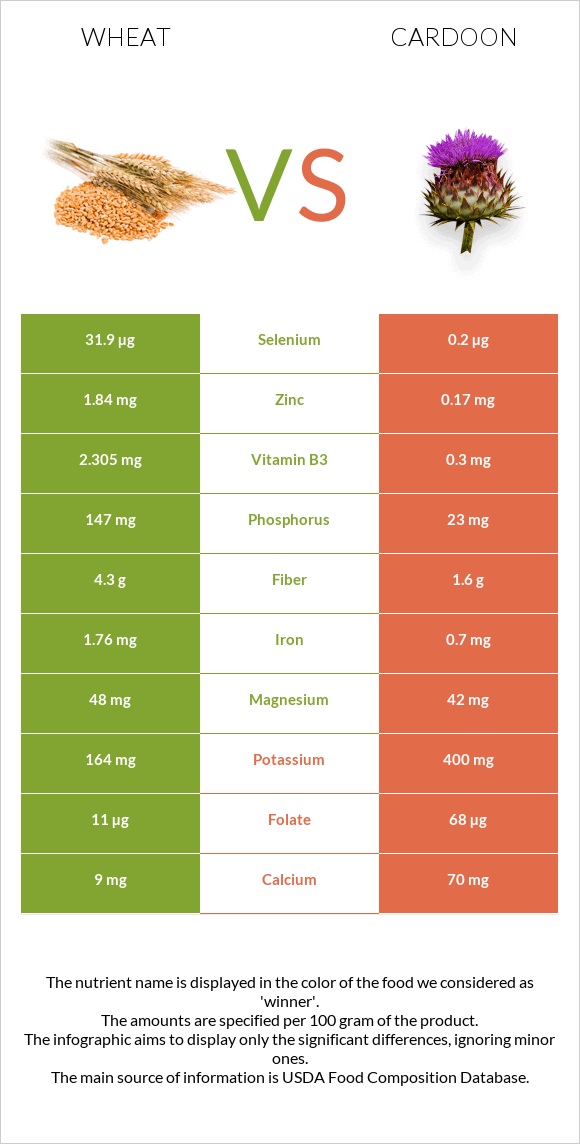
Differences between wheat and cardoon Wheat has more selenium, manganese, phosphorus, zinc, iron, vitamin B3, and fiber, while cardoon has more folate and potassium. Wheat's daily need coverage for selenium is 58% higher. Cardoon contains 11 times less zinc than wheat. Wheat contains 1.84mg of zinc, while cardoon contains 0.17mg. The amount of sodium in wheat is lower. The food types used in this comparison are Wheat, KAMUT khorasan, cooked and Cardoon, raw .
Infographic
Mineral Comparison
Mineral comparison score is based on the number of minerals by which one or the other food is richer. The "coverage" charts below show how much of the daily needs can be covered by 300 grams of the food.
7
100 g
300 g
1 cup - 172g
Magnesium
Magnesium
Calcium
Calcium
Potassium
Potassium
Iron
Iron
Copper
Copper
Zinc
Zinc
Phosphorus
Phosphorus
Sodium
Sodium
Manganese
Manganese
Selenium
Selenium
34%
2.7%
14%
66%
69%
50%
63%
1%
134%
174%
3
100 g
300 g
1 cup, shredded - 178g
Magnesium
Magnesium
Calcium
Calcium
Potassium
Potassium
Iron
Iron
Copper
Copper
Zinc
Zinc
Phosphorus
Phosphorus
Sodium
Sodium
Manganese
Manganese
Selenium
Selenium
30%
21%
35%
26%
77%
4.6%
9.9%
22%
33%
1.1%
Vitamin Comparison
Vitamin comparison score is based on the number of vitamins by which one or the other food is richer. The "coverage" charts below show how much of the daily needs can be covered by 300 grams of the food.
3
100 g
300 g
1 cup - 172g
Vitamin C
Vit. C
Vitamin D
Vit. D
Vitamin A
Vit. A
Vitamin E
Vit. E
Vitamin B1
Vit. B1
Vitamin B2
Vit. B2
Vitamin B3
Vit. B3
Vitamin B5
Vit. B5
Vitamin B6
Vit. B6
Vitamin B12
Vit. B12
Vitamin K
Vit. K
Folate
Folate
0%
0%
0%
4.8%
24%
6.9%
43%
0%
16%
0%
0%
8.3%
4
100 g
300 g
1 cup, shredded - 178g
Vitamin C
Vit. C
Vitamin D
Vit. D
Vitamin A
Vit. A
Vitamin E
Vit. E
Vitamin B1
Vit. B1
Vitamin B2
Vit. B2
Vitamin B3
Vit. B3
Vitamin B5
Vit. B5
Vitamin B6
Vit. B6
Vitamin B12
Vit. B12
Vitamin K
Vit. K
Folate
Folate
6.7%
0%
0%
0%
5%
6.9%
5.6%
20%
27%
0%
0%
51%
All nutrients comparison - raw data values
Nutrient
DV% diff.
Selenium
31.9µg
0.2µg
58%
Manganese
1.03mg
0.256mg
34%
Phosphorus
147mg
23mg
18%
Zinc
1.84mg
0.17mg
15%
Folate
11µg
68µg
14%
Iron
1.76mg
0.7mg
13%
Vitamin B3
2.305mg
0.3mg
13%
Fiber
4.3g
1.6g
11%
Protein
5.71g
0.7g
10%
Carbs
27.6g
4.07g
8%
Potassium
164mg
400mg
7%
Sodium
8mg
170mg
7%
Vitamin B5
0.338mg
7%
Calories
132kcal
17kcal
6%
Calcium
9mg
70mg
6%
Vitamin B1
0.095mg
0.02mg
6%
Vitamin B6
0.07mg
0.116mg
4%
Copper
0.207mg
0.231mg
3%
Vitamin C
2mg
2%
Vitamin E
0.24mg
2%
Fats
0.83g
0.1g
1%
Magnesium
48mg
42mg
1%
Polyunsaturated fat
0.243g
0.041g
1%
Protein per 100 calories
4.3g
4.1g
N/A
Calories per 10 g protein
231kcal
243kcal
N/A
Weight per 100 calories
76g
588g
N/A
Net carbs
23.3g
2.47g
N/A
Sugar
3.07g
N/A
Vitamin B2
0.03mg
0.03mg
0%
Trans fat
0.002g
0g
N/A
Saturated fat
0.077g
0.011g
0%
Monounsaturated fat
0.084g
0.018g
0%
Tryptophan
0.051mg
0%
Threonine
0.172mg
0%
Isoleucine
0.22mg
0%
Leucine
0.432mg
0%
Lysine
0.161mg
0%
Methionine
0.097mg
0%
Phenylalanine
0.3mg
0%
Valine
0.267mg
0%
Histidine
0.147mg
0%
Macronutrient Comparison
Macronutrient breakdown side-by-side comparison
3
6%
28%
65%
Protein:
5.71 g
Fats:
0.83 g
Carbs:
27.6 g
Water:
65.18 g
Other:
0.68 g
2
4%
94%
Protein:
0.7 g
Fats:
0.1 g
Carbs:
4.07 g
Water:
94 g
Other:
1.13 g
Contains
more
Protein Protein
+715.7%
Contains
more
Fats Fats
+730%
Contains
more
Carbs Carbs
+578.1%
Contains
more
Water Water
+44.2%
Contains
more
Other Other
+66.2%
Fat Type Comparison
Fat type breakdown side-by-side comparison
2
19%
21%
60%
Saturated fat:
Sat. Fat
0.077 g
Monounsaturated fat:
Mono. Fat
0.084 g
Polyunsaturated fat:
Poly. Fat
0.243 g
1
16%
26%
59%
Saturated fat:
Sat. Fat
0.011 g
Monounsaturated fat:
Mono. Fat
0.018 g
Polyunsaturated fat:
Poly. Fat
0.041 g
Contains
more
Mono. Fat Monounsaturated fat
+366.7%
Contains
more
Poly. Fat Polyunsaturated fat
+492.7%
Contains
less
Sat. Fat Saturated fat
-85.7%