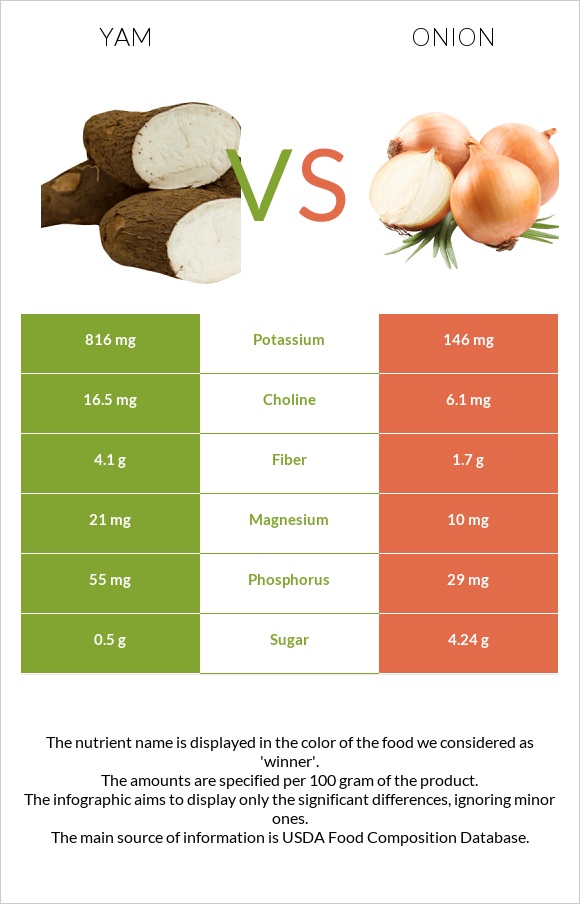
Summary of differences between yam and onions The amount of potassium, copper, vitamin B6, manganese, vitamin C, fiber, and vitamin B1 in yam is higher than in onions. Yam covers your daily need for potassium, 20% more than onions. Yam contains 5 times more copper than onions. While yam contains 0.178mg of copper, onions contain only 0.039mg. Onions have a lower glycemic index. The glycemic index of onions is 15, while the glycemic index of yam is 51. These are the specific foods used in this comparison Yam, raw and Onions, raw .
Infographic
Mineral Comparison
Mineral comparison score is based on the number of minerals by which one or the other food is richer. The "coverage" charts below show how much of the daily needs can be covered by 300 grams of the food.
8
100 g
300 g
1 cup, cubes - 150g
Magnesium
Magnesium
Calcium
Calcium
Potassium
Potassium
Iron
Iron
Copper
Copper
Zinc
Zinc
Phosphorus
Phosphorus
Sodium
Sodium
Manganese
Manganese
Selenium
Selenium
15%
5.1%
72%
20%
59%
6.5%
24%
1.2%
52%
3.8%
2
100 g
300 g
1 slice, thin - 9g 1 tbsp chopped - 10g 1 slice, medium (1/8" thick) - 14g 1 slice, large (1/4" thick) - 38g 10 rings - 60g 1 small - 70g 1 medium (2-1/2" dia) - 110g 1 cup, sliced - 115g 1 large - 150g 1 cup, chopped - 160g
Magnesium
Magnesium
Calcium
Calcium
Potassium
Potassium
Iron
Iron
Copper
Copper
Zinc
Zinc
Phosphorus
Phosphorus
Sodium
Sodium
Manganese
Manganese
Selenium
Selenium
7.1%
6.9%
13%
7.9%
13%
4.6%
12%
0.52%
17%
2.7%
Vitamin Comparison
Vitamin comparison score is based on the number of vitamins by which one or the other food is richer. The "coverage" charts below show how much of the daily needs can be covered by 300 grams of the food.
10
100 g
300 g
1 cup, cubes - 150g
Vitamin C
Vit. C
Vitamin D
Vit. D
Vitamin A
Vit. A
Vitamin E
Vit. E
Vitamin B1
Vit. B1
Vitamin B2
Vit. B2
Vitamin B3
Vit. B3
Vitamin B5
Vit. B5
Vitamin B6
Vit. B6
Vitamin B12
Vit. B12
Vitamin K
Vit. K
Folate
Folate
57%
0%
2.3%
7%
28%
7.4%
10%
19%
68%
0%
5.8%
17%
0
100 g
300 g
1 slice, thin - 9g 1 tbsp chopped - 10g 1 slice, medium (1/8" thick) - 14g 1 slice, large (1/4" thick) - 38g 10 rings - 60g 1 small - 70g 1 medium (2-1/2" dia) - 110g 1 cup, sliced - 115g 1 large - 150g 1 cup, chopped - 160g
Vitamin C
Vit. C
Vitamin D
Vit. D
Vitamin A
Vit. A
Vitamin E
Vit. E
Vitamin B1
Vit. B1
Vitamin B2
Vit. B2
Vitamin B3
Vit. B3
Vitamin B5
Vit. B5
Vitamin B6
Vit. B6
Vitamin B12
Vit. B12
Vitamin K
Vit. K
Folate
Folate
25%
0%
0%
0.4%
12%
6.2%
2.2%
7.4%
28%
0%
1%
14%
All nutrients comparison - raw data values
Nutrient
DV% diff.
Potassium
816mg
146mg
20%
Copper
0.178mg
0.039mg
15%
Vitamin B6
0.293mg
0.12mg
13%
Manganese
0.397mg
0.129mg
12%
Vitamin C
17.1mg
7.4mg
11%
Fiber
4.1g
1.7g
10%
Carbs
27.88g
9.34g
6%
Vitamin B1
0.112mg
0.046mg
6%
Calories
118kcal
40kcal
4%
Iron
0.54mg
0.21mg
4%
Phosphorus
55mg
29mg
4%
Vitamin B5
0.314mg
0.123mg
4%
Magnesium
21mg
10mg
3%
Vitamin B3
0.552mg
0.116mg
3%
Vitamin E
0.35mg
0.02mg
2%
Vitamin K
2.3µg
0.4µg
2%
Choline
16.5mg
6.1mg
2%
Fructose
1.29g
2%
Protein
1.53g
1.1g
1%
Calcium
17mg
23mg
1%
Zinc
0.24mg
0.17mg
1%
Vitamin A
7µg
0µg
1%
Folate
23µg
19µg
1%
Protein per 100 calories
1.3g
2.8g
N/A
Calories per 10 g protein
771kcal
364kcal
N/A
Weight per 100 calories
85g
250g
N/A
Fats
0.17g
0.1g
0%
Net carbs
23.78g
7.64g
N/A
Sugar
0.5g
4.24g
N/A
Sodium
9mg
4mg
0%
Selenium
0.7µg
0.5µg
0%
Vitamin B2
0.032mg
0.027mg
0%
Saturated fat
0.037g
0.042g
0%
Monounsaturated fat
0.006g
0.013g
0%
Polyunsaturated fat
0.076g
0.017g
0%
Tryptophan
0.012mg
0.014mg
0%
Threonine
0.054mg
0.021mg
0%
Isoleucine
0.052mg
0.014mg
0%
Leucine
0.096mg
0.025mg
0%
Lysine
0.059mg
0.039mg
0%
Methionine
0.021mg
0.002mg
0%
Phenylalanine
0.071mg
0.025mg
0%
Valine
0.062mg
0.021mg
0%
Histidine
0.034mg
0.014mg
0%
Macronutrient Comparison
Macronutrient breakdown side-by-side comparison
4
28%
70%
Protein:
1.53 g
Fats:
0.17 g
Carbs:
27.88 g
Water:
69.6 g
Other:
0.82 g
1
9%
89%
Protein:
1.1 g
Fats:
0.1 g
Carbs:
9.34 g
Water:
89.11 g
Other:
0.35 g
Contains
more
Protein Protein
+39.1%
Contains
more
Fats Fats
+70%
Contains
more
Carbs Carbs
+198.5%
Contains
more
Other Other
+134.3%
Contains
more
Water Water
+28%
Fat Type Comparison
Fat type breakdown side-by-side comparison
2
31%
5%
64%
Saturated fat:
Sat. Fat
0.037 g
Monounsaturated fat:
Mono. Fat
0.006 g
Polyunsaturated fat:
Poly. Fat
0.076 g
1
58%
18%
24%
Saturated fat:
Sat. Fat
0.042 g
Monounsaturated fat:
Mono. Fat
0.013 g
Polyunsaturated fat:
Poly. Fat
0.017 g
Contains
less
Sat. Fat Saturated fat
-11.9%
Contains
more
Poly. Fat Polyunsaturated fat
+347.1%
Contains
more
Mono. Fat Monounsaturated fat
+116.7%