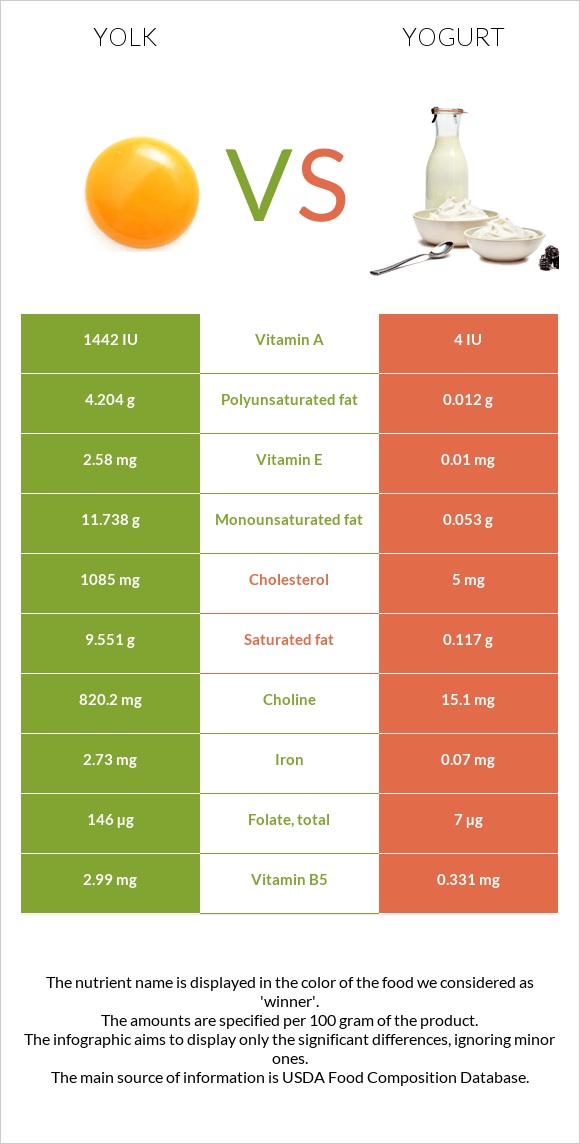
Differences between yolk and yogurt Yogurt contains less choline, selenium, vitamin B5, vitamin B12, phosphorus, folate, iron, and vitamin A than yolk. Yolk's daily need coverage for cholesterol is 360% higher. Yogurt contains 361 times less vitamin A than yolk. Yolk contains 1442 IU of vitamin A, while yogurt contains 4 IU. The amount of cholesterol in yogurt is lower. Yolk has a lower glycemic index. The glycemic index of yolk is 0, while the glycemic index of yogurt is 19. The food types used in this comparison are Egg, yolk, raw, fresh and Yogurt, Greek, plain, nonfat .
Infographic
Mineral Comparison
Mineral comparison score is based on the number of minerals by which one or the other food is richer. The "coverage" charts below show how much of the daily needs can be covered by 300 grams of the food.
7
100 g
300 g
1 large - 17g 1 cup - 243g
Magnesium
Magnesium
Calcium
Calcium
Potassium
Potassium
Iron
Iron
Copper
Copper
Zinc
Zinc
Phosphorus
Phosphorus
Sodium
Sodium
Manganese
Manganese
Selenium
Selenium
3.6%
39%
9.6%
102%
26%
63%
167%
6.3%
7.2%
305%
3
100 g
300 g
1 container - 170g
Magnesium
Magnesium
Calcium
Calcium
Potassium
Potassium
Iron
Iron
Copper
Copper
Zinc
Zinc
Phosphorus
Phosphorus
Sodium
Sodium
Manganese
Manganese
Selenium
Selenium
7.9%
33%
12%
2.6%
5.7%
14%
58%
4.7%
1.2%
53%
Vitamin Comparison
Vitamin comparison score is based on the number of vitamins by which one or the other food is richer. The "coverage" charts below show how much of the daily needs can be covered by 300 grams of the food.
10
100 g
300 g
1 large - 17g 1 cup - 243g
Vitamin C
Vit. C
Vitamin D
Vit. D
Vitamin A
Vit. A
Vitamin E
Vit. E
Vitamin B1
Vit. B1
Vitamin B2
Vit. B2
Vitamin B3
Vit. B3
Vitamin B5
Vit. B5
Vitamin B6
Vit. B6
Vitamin B12
Vit. B12
Vitamin K
Vit. K
Folate
Folate
0%
81%
127%
52%
44%
122%
0.45%
179%
81%
244%
1.8%
110%
1
100 g
300 g
1 container - 170g
Vitamin C
Vit. C
Vitamin D
Vit. D
Vitamin A
Vit. A
Vitamin E
Vit. E
Vitamin B1
Vit. B1
Vitamin B2
Vit. B2
Vitamin B3
Vit. B3
Vitamin B5
Vit. B5
Vitamin B6
Vit. B6
Vitamin B12
Vit. B12
Vitamin K
Vit. K
Folate
Folate
0%
0%
0.33%
0.2%
5.8%
64%
3.9%
20%
15%
94%
0%
5.3%
All nutrients comparison - raw data values
Nutrient
DV% diff.
Cholesterol
1085mg
5mg
360%
Choline
820.2mg
15.1mg
146%
Selenium
56µg
9.7µg
84%
Vitamin B5
2.99mg
0.331mg
53%
Vitamin B12
1.95µg
0.75µg
50%
Saturated fat
9.551g
0.117g
43%
Vitamin A
381µg
1µg
42%
Fats
26.54g
0.39g
40%
Phosphorus
390mg
135mg
36%
Folate
146µg
7µg
35%
Iron
2.73mg
0.07mg
33%
Monounsaturated fat
11.738g
0.053g
29%
Polyunsaturated fat
4.204g
0.012g
28%
Vitamin D*
218 IU
0 IU
27%
Vitamin D
5.4µg
0µg
27%
Vitamin B6
0.35mg
0.063mg
22%
Vitamin B2
0.528mg
0.278mg
19%
Vitamin E
2.58mg
0.01mg
17%
Zinc
2.3mg
0.52mg
16%
Calories
322kcal
59kcal
13%
Vitamin B1
0.176mg
0.023mg
13%
Protein
15.86g
10.19g
11%
Copper
0.077mg
0.017mg
7%
Calcium
129mg
110mg
2%
Manganese
0.055mg
0.009mg
2%
Magnesium
5mg
11mg
1%
Potassium
109mg
141mg
1%
Sodium
48mg
36mg
1%
Vitamin B3
0.024mg
0.208mg
1%
Vitamin K
0.7µg
0µg
1%
Protein per 100 calories
4.9g
17g
N/A
Calories per 10 g protein
203kcal
58kcal
N/A
Weight per 100 calories
31g
169g
N/A
Unsaturated / Saturated Fat ratio
1.7
0.56
N/A
Net carbs
3.59g
3.6g
N/A
Carbs
3.59g
3.6g
0%
Sugar
0.56g
3.24g
N/A
Trans fat
0.006g
N/A
Tryptophan
0.177mg
0%
Threonine
0.687mg
0%
Isoleucine
0.866mg
0%
Leucine
1.399mg
0%
Lysine
1.217mg
0%
Methionine
0.378mg
0%
Phenylalanine
0.681mg
0%
Valine
0.949mg
0%
Histidine
0.416mg
0%
Fructose
0.07g
0g
0%
Omega-3 - EPA
0.011g
0g
N/A
Omega-3 - DHA
0.114g
0g
N/A
Omega-3 - ALA
0.001g
N/A
Omega-6 - Linoleic acid
0.01g
N/A
Macronutrient Comparison
Macronutrient breakdown side-by-side comparison
3
16%
27%
4%
52%
2%
Protein:
15.86 g
Fats:
26.54 g
Carbs:
3.59 g
Water:
52.31 g
Other:
1.7 g
2
10%
4%
85%
Protein:
10.19 g
Fats:
0.39 g
Carbs:
3.6 g
Water:
85.1 g
Other:
0.72 g
Contains
more
Protein Protein
+55.6%
Contains
more
Fats Fats
+6705.1%
Contains
more
Other Other
+136.1%
Contains
more
Water Water
+62.7%
Fat Type Comparison
Fat type breakdown side-by-side comparison
2
37%
46%
16%
Saturated fat:
Sat. Fat
9.551 g
Monounsaturated fat:
Mono. Fat
11.738 g
Polyunsaturated fat:
Poly. Fat
4.204 g
1
64%
29%
7%
Saturated fat:
Sat. Fat
0.117 g
Monounsaturated fat:
Mono. Fat
0.053 g
Polyunsaturated fat:
Poly. Fat
0.012 g
Contains
more
Mono. Fat Monounsaturated fat
+22047.2%
Contains
more
Poly. Fat Polyunsaturated fat
+34933.3%
Contains
less
Sat. Fat Saturated fat
-98.8%
Carbohydrate type comparison
Carbohydrate type breakdown side-by-side comparison
4
13%
34%
13%
13%
13%
13%
Starch:
0 g
Sucrose:
0.07 g
Glucose:
0.18 g
Fructose:
0.07 g
Lactose:
0.07 g
Maltose:
0.07 g
Galactose:
0.07 g
2
78%
22%
Starch:
0 g
Sucrose:
0 g
Glucose:
0 g
Fructose:
0 g
Lactose:
2.54 g
Maltose:
0 g
Galactose:
0.7 g
Contains
more
Sucrose Sucrose
+∞%
Contains
more
Glucose Glucose
+∞%
Contains
more
Fructose Fructose
+∞%
Contains
more
Maltose Maltose
+∞%
Contains
more
Lactose Lactose
+3528.6%
Contains
more
Galactose Galactose
+900%