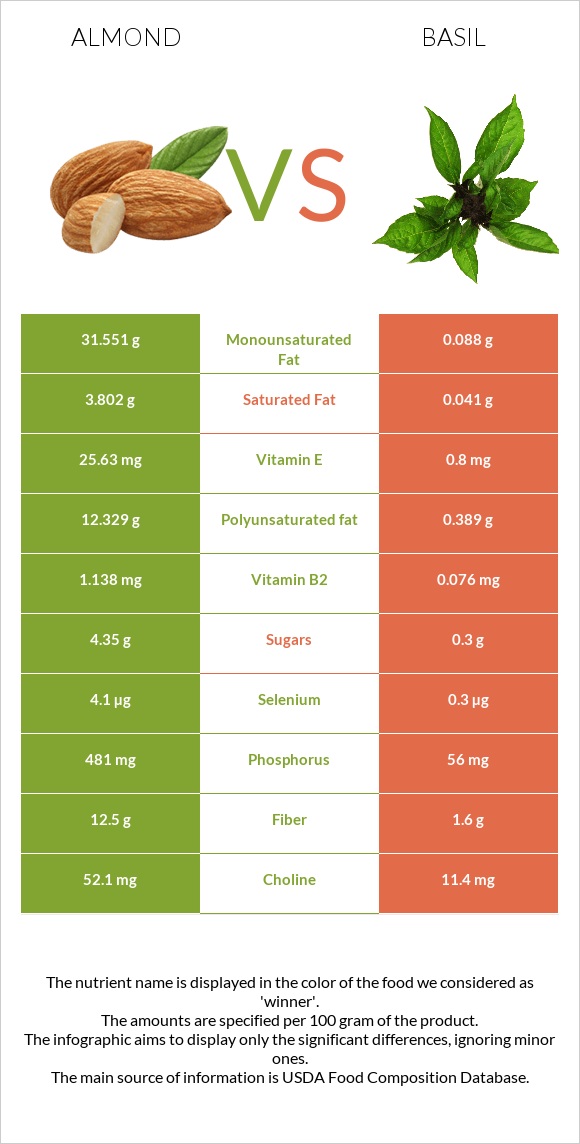
A recap on the differences between almonds and basil Almonds have more vitamin E, vitamin B2, copper, phosphorus, magnesium, manganese, fiber, and zinc; however, basil is higher in vitamin K and vitamin A. Basil covers your daily vitamin K needs 346% more than almonds. Basil contains 32 times less vitamin E than almonds. Almonds contain 25.63mg of vitamin E, while basil contains 0.8mg. The glycemic index of basil is higher. Food varieties used in this article are Nuts, almonds and Basil, fresh .
Infographic
Mineral Comparison
Mineral comparison score is based on the number of minerals by which one or the other food is richer. The "coverage" charts below show how much of the daily needs can be covered by 300 grams of the food.
10
100 g
300 g
1 almond - 1.2g 1 oz (23 whole kernels) - 28.35g 1 cup, sliced - 92g 1 cup, ground - 95g 1 cup, slivered - 108g 1 cup, whole - 143g
Magnesium
Magnesium
Calcium
Calcium
Potassium
Potassium
Iron
Iron
Copper
Copper
Zinc
Zinc
Phosphorus
Phosphorus
Sodium
Sodium
Manganese
Manganese
Selenium
Selenium
193%
81%
65%
139%
344%
85%
206%
0.13%
284%
22%
0
100 g
300 g
5 leaves - 2.5g 2 tbsp, chopped - 5.3g 0.25 cup leaves, whole - 6g
Magnesium
Magnesium
Calcium
Calcium
Potassium
Potassium
Iron
Iron
Copper
Copper
Zinc
Zinc
Phosphorus
Phosphorus
Sodium
Sodium
Manganese
Manganese
Selenium
Selenium
46%
53%
26%
119%
128%
22%
24%
0.52%
150%
1.6%
Vitamin Comparison
Vitamin comparison score is based on the number of vitamins by which one or the other food is richer. The "coverage" charts below show how much of the daily needs can be covered by 300 grams of the food.
5
100 g
300 g
1 almond - 1.2g 1 oz (23 whole kernels) - 28.35g 1 cup, sliced - 92g 1 cup, ground - 95g 1 cup, slivered - 108g 1 cup, whole - 143g
Vitamin C
Vit. C
Vitamin D
Vit. D
Vitamin A
Vit. A
Vitamin E
Vit. E
Vitamin B1
Vit. B1
Vitamin B2
Vit. B2
Vitamin B3
Vit. B3
Vitamin B5
Vit. B5
Vitamin B6
Vit. B6
Vitamin B12
Vit. B12
Vitamin K
Vit. K
Folate
Folate
0%
0%
0%
513%
51%
263%
68%
28%
32%
0%
0%
33%
5
100 g
300 g
5 leaves - 2.5g 2 tbsp, chopped - 5.3g 0.25 cup leaves, whole - 6g
Vitamin C
Vit. C
Vitamin D
Vit. D
Vitamin A
Vit. A
Vitamin E
Vit. E
Vitamin B1
Vit. B1
Vitamin B2
Vit. B2
Vitamin B3
Vit. B3
Vitamin B5
Vit. B5
Vitamin B6
Vit. B6
Vitamin B12
Vit. B12
Vitamin K
Vit. K
Folate
Folate
60%
0%
88%
16%
8.5%
18%
17%
13%
36%
0%
1037%
51%
All nutrients comparison - raw data values
Nutrient
DV% diff.
Vitamin K
0µg
414.8µg
346%
Vitamin E
25.63mg
0.8mg
166%
Vitamin B2
1.138mg
0.076mg
82%
Polyunsaturated fat
12.329g
0.389g
80%
Monounsaturated fat
31.551g
0.088g
79%
Fats
49.93g
0.64g
76%
Copper
1.031mg
0.385mg
72%
Phosphorus
481mg
56mg
61%
Magnesium
270mg
64mg
49%
Manganese
2.179mg
1.148mg
45%
Fiber
12.5g
1.6g
44%
Protein
21.15g
3.15g
36%
Vitamin A
0µg
264µg
29%
Calories
579kcal
23kcal
28%
Zinc
3.12mg
0.81mg
21%
Vitamin C
0mg
18mg
20%
Vitamin B3
3.618mg
0.902mg
17%
Saturated fat
3.802g
0.041g
17%
Vitamin B1
0.205mg
0.034mg
14%
Potassium
733mg
295mg
13%
Calcium
269mg
177mg
9%
Iron
3.71mg
3.17mg
7%
Selenium
4.1µg
0.3µg
7%
Choline
52.1mg
11.4mg
7%
Carbs
21.55g
2.65g
6%
Folate
44µg
68µg
6%
Vitamin B5
0.471mg
0.209mg
5%
Vitamin B6
0.137mg
0.155mg
1%
Protein per 100 calories
3.7g
14g
N/A
Calories per 10 g protein
274kcal
73kcal
N/A
Weight per 100 calories
17g
435g
N/A
Unsaturated / Saturated Fat ratio
12
12
N/A
Net carbs
9.05g
1.05g
N/A
Sugar
4.35g
0.3g
N/A
Starch
0.72g
0%
Sodium
1mg
4mg
0%
Trans fat
0.015g
0g
N/A
Tryptophan
0.211mg
0.039mg
0%
Threonine
0.601mg
0.104mg
0%
Isoleucine
0.751mg
0.104mg
0%
Leucine
1.473mg
0.191mg
0%
Lysine
0.568mg
0.11mg
0%
Methionine
0.157mg
0.036mg
0%
Phenylalanine
1.132mg
0.13mg
0%
Valine
0.855mg
0.127mg
0%
Histidine
0.539mg
0.051mg
0%
Fructose
0.11g
0.02g
0%
Omega-3 - ALA
0.003g
N/A
Omega-6 - Eicosadienoic acid
0.002g
N/A
Omega-6 - Linoleic acid
12.32g
N/A
Macronutrient Comparison
Macronutrient breakdown side-by-side comparison
4
21%
50%
22%
4%
3%
Protein:
21.15 g
Fats:
49.93 g
Carbs:
21.55 g
Water:
4.41 g
Other:
2.96 g
1
3%
3%
92%
Protein:
3.15 g
Fats:
0.64 g
Carbs:
2.65 g
Water:
92.06 g
Other:
1.5 g
Contains
more
Protein Protein
+571.4%
Contains
more
Fats Fats
+7701.6%
Contains
more
Carbs Carbs
+713.2%
Contains
more
Other Other
+97.3%
Contains
more
Water Water
+1987.5%
Fat Type Comparison
Fat type breakdown side-by-side comparison
2
8%
66%
26%
Saturated fat:
Sat. Fat
3.802 g
Monounsaturated fat:
Mono. Fat
31.551 g
Polyunsaturated fat:
Poly. Fat
12.329 g
1
8%
17%
75%
Saturated fat:
Sat. Fat
0.041 g
Monounsaturated fat:
Mono. Fat
0.088 g
Polyunsaturated fat:
Poly. Fat
0.389 g
Contains
more
Mono. Fat Monounsaturated fat
+35753.4%
Contains
more
Poly. Fat Polyunsaturated fat
+3069.4%
Contains
less
Sat. Fat Saturated fat
-98.9%
Carbohydrate type comparison
Carbohydrate type breakdown side-by-side comparison
5
14%
78%
3%
2%
Starch:
0.72 g
Sucrose:
3.95 g
Glucose:
0.17 g
Fructose:
0.11 g
Lactose:
0 g
Maltose:
0.04 g
Galactose:
0.07 g
1
6%
6%
87%
Starch:
0 g
Sucrose:
0 g
Glucose:
0.02 g
Fructose:
0.02 g
Lactose:
0 g
Maltose:
0 g
Galactose:
0.27 g
Contains
more
Starch Starch
+∞%
Contains
more
Sucrose Sucrose
+∞%
Contains
more
Glucose Glucose
+750%
Contains
more
Fructose Fructose
+450%
Contains
more
Maltose Maltose
+∞%
Contains
more
Galactose Galactose
+285.7%