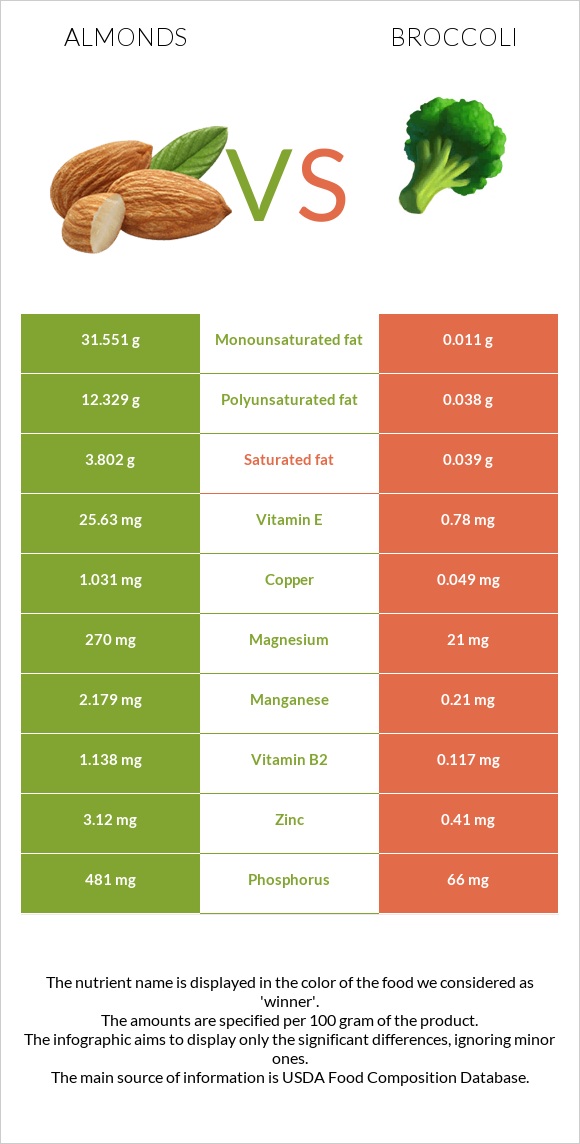
Differences between almonds and broccoli Almonds are higher in vitamin E, copper, manganese, vitamin B2, phosphorus, magnesium, fiber, and iron; however, broccoli is richer in vitamin C and vitamin K. Almonds' daily need coverage for vitamin E is 166% higher. Almonds have 21 times more copper than broccoli. While almonds have 1.031mg of copper, broccoli has only 0.049mg. Almonds have a lower glycemic index (0) than broccoli (32). The food types used in this comparison are Nuts, almonds and Broccoli, raw .
Infographic
Mineral Comparison
Mineral comparison score is based on the number of minerals by which one or the other food is richer. The "coverage" charts below show how much of the daily needs can be covered by 300 grams of the food.
10
100 g
300 g
1 almond - 1.2g 1 oz (23 whole kernels) - 28.35g 1 cup, sliced - 92g 1 cup, ground - 95g 1 cup, slivered - 108g 1 cup, whole - 143g
Magnesium
Magnesium
Calcium
Calcium
Potassium
Potassium
Iron
Iron
Copper
Copper
Zinc
Zinc
Phosphorus
Phosphorus
Sodium
Sodium
Manganese
Manganese
Selenium
Selenium
193%
81%
65%
139%
344%
85%
206%
0.13%
284%
22%
0
100 g
300 g
1 spear (about 5" long) - 31g 0.5 cup, chopped or diced - 44g 1 cup chopped - 91g 1 NLEA serving - 148g 1 stalk - 151g 1 bunch - 608g
Magnesium
Magnesium
Calcium
Calcium
Potassium
Potassium
Iron
Iron
Copper
Copper
Zinc
Zinc
Phosphorus
Phosphorus
Sodium
Sodium
Manganese
Manganese
Selenium
Selenium
15%
14%
28%
27%
16%
11%
28%
4.3%
27%
14%
Vitamin Comparison
Vitamin comparison score is based on the number of vitamins by which one or the other food is richer. The "coverage" charts below show how much of the daily needs can be covered by 300 grams of the food.
4
100 g
300 g
1 almond - 1.2g 1 oz (23 whole kernels) - 28.35g 1 cup, sliced - 92g 1 cup, ground - 95g 1 cup, slivered - 108g 1 cup, whole - 143g
Vitamin C
Vit. C
Vitamin D
Vit. D
Vitamin A
Vit. A
Vitamin E
Vit. E
Vitamin B1
Vit. B1
Vitamin B2
Vit. B2
Vitamin B3
Vit. B3
Vitamin B5
Vit. B5
Vitamin B6
Vit. B6
Vitamin B12
Vit. B12
Vitamin K
Vit. K
Folate
Folate
0%
0%
0%
513%
51%
263%
68%
28%
32%
0%
0%
33%
6
100 g
300 g
1 spear (about 5" long) - 31g 0.5 cup, chopped or diced - 44g 1 cup chopped - 91g 1 NLEA serving - 148g 1 stalk - 151g 1 bunch - 608g
Vitamin C
Vit. C
Vitamin D
Vit. D
Vitamin A
Vit. A
Vitamin E
Vit. E
Vitamin B1
Vit. B1
Vitamin B2
Vit. B2
Vitamin B3
Vit. B3
Vitamin B5
Vit. B5
Vitamin B6
Vit. B6
Vitamin B12
Vit. B12
Vitamin K
Vit. K
Folate
Folate
297%
0%
10%
16%
18%
27%
12%
34%
40%
0%
254%
47%
All nutrients comparison - raw data values
Nutrient
DV% diff.
Vitamin E
25.63mg
0.78mg
166%
Copper
1.031mg
0.049mg
109%
Vitamin C
0mg
89.2mg
99%
Manganese
2.179mg
0.21mg
86%
Vitamin K
0µg
101.6µg
85%
Polyunsaturated fat
12.329g
0.038g
82%
Vitamin B2
1.138mg
0.117mg
79%
Monounsaturated fat
31.551g
0.011g
79%
Fats
49.93g
0.37g
76%
Magnesium
270mg
21mg
59%
Phosphorus
481mg
66mg
59%
Fiber
12.5g
2.6g
40%
Protein
21.15g
2.82g
37%
Iron
3.71mg
0.73mg
37%
Calories
579kcal
34kcal
27%
Zinc
3.12mg
0.41mg
25%
Calcium
269mg
47mg
22%
Vitamin B3
3.618mg
0.639mg
19%
Saturated fat
3.802g
0.039g
17%
Potassium
733mg
316mg
12%
Vitamin B1
0.205mg
0.071mg
11%
Choline
52.1mg
18.7mg
6%
Carbs
21.55g
6.64g
5%
Folate
44µg
63µg
5%
Vitamin A
0µg
31µg
3%
Selenium
4.1µg
2.5µg
3%
Vitamin B6
0.137mg
0.175mg
3%
Vitamin B5
0.471mg
0.573mg
2%
Sodium
1mg
33mg
1%
Fructose
0.11g
0.68g
1%
Protein per 100 calories
3.7g
8.3g
N/A
Calories per 10 g protein
274kcal
121kcal
N/A
Weight per 100 calories
17g
294g
N/A
Unsaturated / Saturated Fat ratio
12
1.3
N/A
Net carbs
9.05g
4.04g
N/A
Sugar
4.35g
1.7g
N/A
Starch
0.72g
0g
0%
Trans fat
0.015g
0g
N/A
Tryptophan
0.211mg
0.033mg
0%
Threonine
0.601mg
0.088mg
0%
Isoleucine
0.751mg
0.079mg
0%
Leucine
1.473mg
0.129mg
0%
Lysine
0.568mg
0.135mg
0%
Methionine
0.157mg
0.038mg
0%
Phenylalanine
1.132mg
0.117mg
0%
Valine
0.855mg
0.125mg
0%
Histidine
0.539mg
0.059mg
0%
Omega-3 - ALA
0.003g
N/A
Omega-6 - Eicosadienoic acid
0.002g
0g
N/A
Omega-6 - Linoleic acid
12.32g
N/A
Macronutrient Comparison
Macronutrient breakdown side-by-side comparison
4
21%
50%
22%
4%
3%
Protein:
21.15 g
Fats:
49.93 g
Carbs:
21.55 g
Water:
4.41 g
Other:
2.96 g
1
3%
7%
89%
Protein:
2.82 g
Fats:
0.37 g
Carbs:
6.64 g
Water:
89.3 g
Other:
0.87 g
Contains
more
Protein Protein
+650%
Contains
more
Fats Fats
+13394.6%
Contains
more
Carbs Carbs
+224.5%
Contains
more
Other Other
+240.2%
Contains
more
Water Water
+1924.9%
Fat Type Comparison
Fat type breakdown side-by-side comparison
2
8%
66%
26%
Saturated fat:
Sat. Fat
3.802 g
Monounsaturated fat:
Mono. Fat
31.551 g
Polyunsaturated fat:
Poly. Fat
12.329 g
1
44%
13%
43%
Saturated fat:
Sat. Fat
0.039 g
Monounsaturated fat:
Mono. Fat
0.011 g
Polyunsaturated fat:
Poly. Fat
0.038 g
Contains
more
Mono. Fat Monounsaturated fat
+286727.3%
Contains
more
Poly. Fat Polyunsaturated fat
+32344.7%
Contains
less
Sat. Fat Saturated fat
-99%
Carbohydrate type comparison
Carbohydrate type breakdown side-by-side comparison
3
14%
78%
3%
2%
Starch:
0.72 g
Sucrose:
3.95 g
Glucose:
0.17 g
Fructose:
0.11 g
Lactose:
0 g
Maltose:
0.04 g
Galactose:
0.07 g
4
6%
29%
40%
12%
12%
Starch:
0 g
Sucrose:
0.1 g
Glucose:
0.49 g
Fructose:
0.68 g
Lactose:
0.21 g
Maltose:
0.21 g
Galactose:
0 g
Contains
more
Starch Starch
+∞%
Contains
more
Sucrose Sucrose
+3850%
Contains
more
Galactose Galactose
+∞%
Contains
more
Glucose Glucose
+188.2%
Contains
more
Fructose Fructose
+518.2%
Contains
more
Lactose Lactose
+∞%
Contains
more
Maltose Maltose
+425%