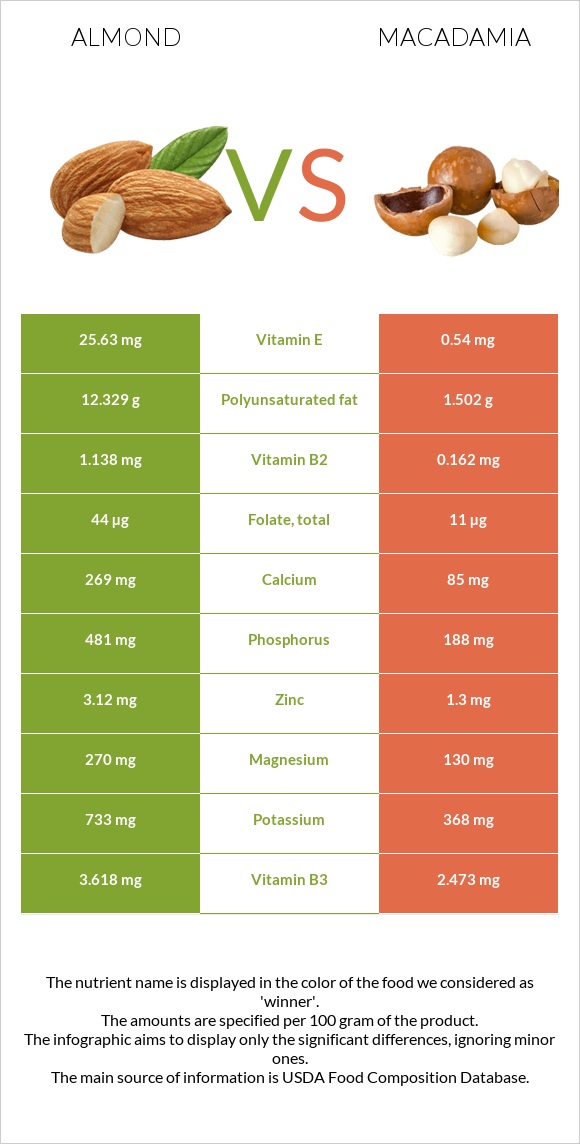
Important differences between almonds and macadamia Almonds have more vitamin E, vitamin B2, phosphorus, magnesium, copper, calcium, and zinc; however, macadamia is richer in manganese and vitamin B1. Almonds' daily need coverage for vitamin E is 167% more. Almonds contain 7 times more vitamin B2 than macadamia. Almonds contain 1.138mg of vitamin B2, while macadamia contains 0.162mg. Almonds contain less saturated fat. The food varieties used in the comparison are Nuts, almonds and Nuts, macadamia nuts, raw .
Infographic
Mineral Comparison
Mineral comparison score is based on the number of minerals by which one or the other food is richer. The "coverage" charts below show how much of the daily needs can be covered by 300 grams of the food.
8
100 g
300 g
1 almond - 1.2g 1 oz (23 whole kernels) - 28.35g 1 cup, sliced - 92g 1 cup, ground - 95g 1 cup, slivered - 108g 1 cup, whole - 143g
Magnesium
Magnesium
Calcium
Calcium
Potassium
Potassium
Iron
Iron
Copper
Copper
Zinc
Zinc
Phosphorus
Phosphorus
Sodium
Sodium
Manganese
Manganese
Selenium
Selenium
193%
81%
65%
139%
344%
85%
206%
0.13%
284%
22%
1
100 g
300 g
1 oz (10-12 kernels) - 28.35g 1 cup, whole or halves - 134g
Magnesium
Magnesium
Calcium
Calcium
Potassium
Potassium
Iron
Iron
Copper
Copper
Zinc
Zinc
Phosphorus
Phosphorus
Sodium
Sodium
Manganese
Manganese
Selenium
Selenium
93%
26%
32%
138%
252%
35%
81%
0.65%
539%
20%
Vitamin Comparison
Vitamin comparison score is based on the number of vitamins by which one or the other food is richer. The "coverage" charts below show how much of the daily needs can be covered by 300 grams of the food.
4
100 g
300 g
1 almond - 1.2g 1 oz (23 whole kernels) - 28.35g 1 cup, sliced - 92g 1 cup, ground - 95g 1 cup, slivered - 108g 1 cup, whole - 143g
Vitamin C
Vit. C
Vitamin D
Vit. D
Vitamin A
Vit. A
Vitamin E
Vit. E
Vitamin B1
Vit. B1
Vitamin B2
Vit. B2
Vitamin B3
Vit. B3
Vitamin B5
Vit. B5
Vitamin B6
Vit. B6
Vitamin B12
Vit. B12
Vitamin K
Vit. K
Folate
Folate
0%
0%
0%
513%
51%
263%
68%
28%
32%
0%
0%
33%
4
100 g
300 g
1 oz (10-12 kernels) - 28.35g 1 cup, whole or halves - 134g
Vitamin C
Vit. C
Vitamin D
Vit. D
Vitamin A
Vit. A
Vitamin E
Vit. E
Vitamin B1
Vit. B1
Vitamin B2
Vit. B2
Vitamin B3
Vit. B3
Vitamin B5
Vit. B5
Vitamin B6
Vit. B6
Vitamin B12
Vit. B12
Vitamin K
Vit. K
Folate
Folate
4%
0%
0%
11%
299%
37%
46%
45%
63%
0%
0%
8.3%
All nutrients comparison - raw data values
Nutrient
DV% diff.
Vitamin E
25.63mg
0.54mg
167%
Manganese
2.179mg
4.131mg
85%
Vitamin B1
0.205mg
1.195mg
83%
Vitamin B2
1.138mg
0.162mg
75%
Polyunsaturated fat
12.329g
1.502g
72%
Monounsaturated fat
31.551g
58.877g
68%
Phosphorus
481mg
188mg
42%
Fats
49.93g
75.77g
40%
Saturated fat
3.802g
12.061g
38%
Magnesium
270mg
130mg
33%
Copper
1.031mg
0.756mg
31%
Protein
21.15g
7.91g
26%
Calcium
269mg
85mg
18%
Zinc
3.12mg
1.3mg
17%
Fiber
12.5g
8.6g
16%
Potassium
733mg
368mg
11%
Vitamin B6
0.137mg
0.275mg
11%
Choline
52.1mg
9%
Folate
44µg
11µg
8%
Calories
579kcal
718kcal
7%
Vitamin B3
3.618mg
2.473mg
7%
Vitamin B5
0.471mg
0.758mg
6%
Carbs
21.55g
13.82g
3%
Vitamin C
0mg
1.2mg
1%
Selenium
4.1µg
3.6µg
1%
Protein per 100 calories
3.7g
1.1g
N/A
Calories per 10 g protein
274kcal
908kcal
N/A
Weight per 100 calories
17g
14g
N/A
Unsaturated / Saturated Fat ratio
12
5
N/A
Net carbs
9.05g
5.22g
N/A
Iron
3.71mg
3.69mg
0%
Sugar
4.35g
4.57g
N/A
Starch
0.72g
1.05g
0%
Sodium
1mg
5mg
0%
Trans fat
0.015g
N/A
Tryptophan
0.211mg
0.067mg
0%
Threonine
0.601mg
0.37mg
0%
Isoleucine
0.751mg
0.314mg
0%
Leucine
1.473mg
0.602mg
0%
Lysine
0.568mg
0.018mg
0%
Methionine
0.157mg
0.023mg
0%
Phenylalanine
1.132mg
0.665mg
0%
Valine
0.855mg
0.363mg
0%
Histidine
0.539mg
0.195mg
0%
Fructose
0.11g
0.07g
0%
Omega-3 - ALA
0.003g
N/A
Omega-6 - Eicosadienoic acid
0.002g
0g
N/A
Omega-6 - Linoleic acid
12.32g
N/A
Macronutrient Comparison
Macronutrient breakdown side-by-side comparison
4
21%
50%
22%
4%
3%
Protein:
21.15 g
Fats:
49.93 g
Carbs:
21.55 g
Water:
4.41 g
Other:
2.96 g
1
8%
76%
14%
Protein:
7.91 g
Fats:
75.77 g
Carbs:
13.82 g
Water:
1.36 g
Other:
1.14 g
Contains
more
Protein Protein
+167.4%
Contains
more
Carbs Carbs
+55.9%
Contains
more
Water Water
+224.3%
Contains
more
Other Other
+159.6%
Contains
more
Fats Fats
+51.8%
Fat Type Comparison
Fat type breakdown side-by-side comparison
2
8%
66%
26%
Saturated fat:
Sat. Fat
3.802 g
Monounsaturated fat:
Mono. Fat
31.551 g
Polyunsaturated fat:
Poly. Fat
12.329 g
1
17%
81%
2%
Saturated fat:
Sat. Fat
12.061 g
Monounsaturated fat:
Mono. Fat
58.877 g
Polyunsaturated fat:
Poly. Fat
1.502 g
Contains
less
Sat. Fat Saturated fat
-68.5%
Contains
more
Poly. Fat Polyunsaturated fat
+720.8%
Contains
more
Mono. Fat Monounsaturated fat
+86.6%
Carbohydrate type comparison
Carbohydrate type breakdown side-by-side comparison
4
14%
78%
3%
2%
Starch:
0.72 g
Sucrose:
3.95 g
Glucose:
0.17 g
Fructose:
0.11 g
Lactose:
0 g
Maltose:
0.04 g
Galactose:
0.07 g
2
19%
79%
Starch:
1.05 g
Sucrose:
4.43 g
Glucose:
0.07 g
Fructose:
0.07 g
Lactose:
0 g
Maltose:
0 g
Galactose:
0 g
Contains
more
Glucose Glucose
+142.9%
Contains
more
Fructose Fructose
+57.1%
Contains
more
Maltose Maltose
+∞%
Contains
more
Galactose Galactose
+∞%
Contains
more
Starch Starch
+45.8%
Contains
more
Sucrose Sucrose
+12.2%