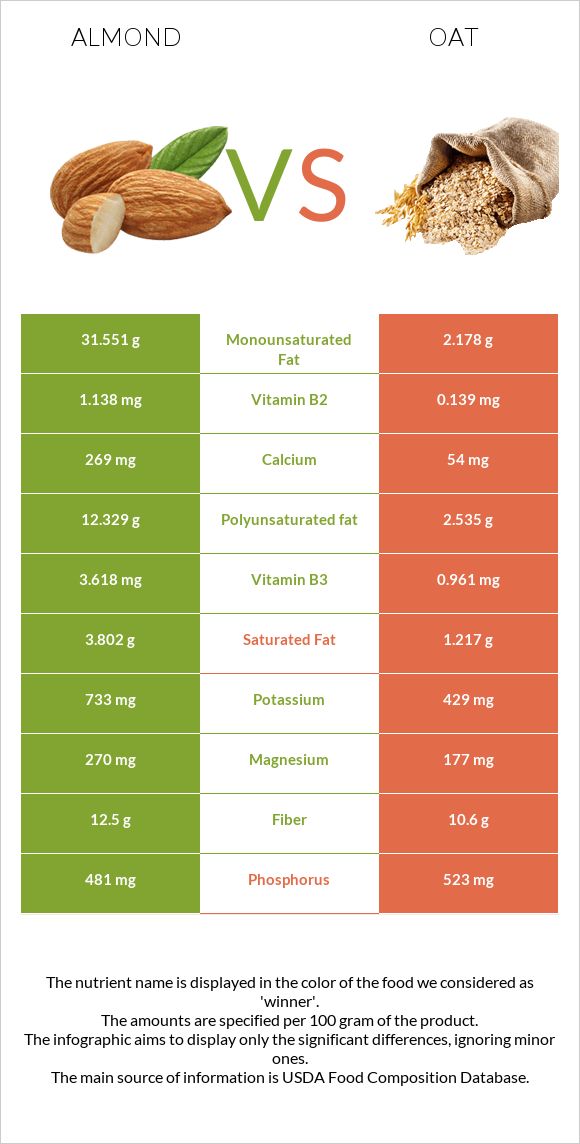
How are almonds and oats different? Almonds are higher in vitamin B2, copper, magnesium, calcium, and vitamin B3; however, oats are richer in manganese, vitamin B1, vitamin B5, and iron. Daily need coverage for manganese for oats is 119% higher. Almonds contain 8 times more vitamin B2 than oats. While almonds contain 1.138mg of vitamin B2, oats contain only 0.139mg. Oats have less saturated fat. Almonds have a lower glycemic index (0) than oats (59). Nuts, almonds and Oats are the varieties used in this article.
Infographic
Mineral Comparison
Mineral comparison score is based on the number of minerals by which one or the other food is richer. The "coverage" charts below show how much of the daily needs can be covered by 300 grams of the food.
6
100 g
300 g
1 almond - 1.2g 1 oz (23 whole kernels) - 28.35g 1 cup, sliced - 92g 1 cup, ground - 95g 1 cup, slivered - 108g 1 cup, whole - 143g
Magnesium
Magnesium
Calcium
Calcium
Potassium
Potassium
Iron
Iron
Copper
Copper
Zinc
Zinc
Phosphorus
Phosphorus
Sodium
Sodium
Manganese
Manganese
Selenium
Selenium
193%
81%
65%
139%
344%
85%
206%
0.13%
284%
22%
3
100 g
300 g
1 cup - 156g
Magnesium
Magnesium
Calcium
Calcium
Potassium
Potassium
Iron
Iron
Copper
Copper
Zinc
Zinc
Phosphorus
Phosphorus
Sodium
Sodium
Manganese
Manganese
Selenium
Selenium
126%
16%
38%
177%
209%
108%
224%
0.26%
641%
0%
Vitamin Comparison
Vitamin comparison score is based on the number of vitamins by which one or the other food is richer. The "coverage" charts below show how much of the daily needs can be covered by 300 grams of the food.
4
100 g
300 g
1 almond - 1.2g 1 oz (23 whole kernels) - 28.35g 1 cup, sliced - 92g 1 cup, ground - 95g 1 cup, slivered - 108g 1 cup, whole - 143g
Vitamin C
Vit. C
Vitamin D
Vit. D
Vitamin A
Vit. A
Vitamin E
Vit. E
Vitamin B1
Vit. B1
Vitamin B2
Vit. B2
Vitamin B3
Vit. B3
Vitamin B5
Vit. B5
Vitamin B6
Vit. B6
Vitamin B12
Vit. B12
Vitamin K
Vit. K
Folate
Folate
0%
0%
0%
513%
51%
263%
68%
28%
32%
0%
0%
33%
3
100 g
300 g
1 cup - 156g
Vitamin C
Vit. C
Vitamin D
Vit. D
Vitamin A
Vit. A
Vitamin E
Vit. E
Vitamin B1
Vit. B1
Vitamin B2
Vit. B2
Vitamin B3
Vit. B3
Vitamin B5
Vit. B5
Vitamin B6
Vit. B6
Vitamin B12
Vit. B12
Vitamin K
Vit. K
Folate
Folate
0%
0%
0%
0%
191%
32%
18%
81%
27%
0%
0%
42%
All nutrients comparison - raw data values
Nutrient
DV% diff.
Vitamin E
25.63mg
171%
Manganese
2.179mg
4.916mg
119%
Vitamin B2
1.138mg
0.139mg
77%
Monounsaturated fat
31.551g
2.178g
73%
Fats
49.93g
6.9g
66%
Polyunsaturated fat
12.329g
2.535g
65%
Vitamin B1
0.205mg
0.763mg
47%
Copper
1.031mg
0.626mg
45%
Magnesium
270mg
177mg
22%
Calcium
269mg
54mg
22%
Vitamin B5
0.471mg
1.349mg
18%
Vitamin B3
3.618mg
0.961mg
17%
Carbs
21.55g
66.27g
15%
Iron
3.71mg
4.72mg
13%
Saturated fat
3.802g
1.217g
12%
Calories
579kcal
389kcal
10%
Protein
21.15g
16.89g
9%
Potassium
733mg
429mg
9%
Choline
52.1mg
9%
Fiber
12.5g
10.6g
8%
Zinc
3.12mg
3.97mg
8%
Selenium
4.1µg
7%
Phosphorus
481mg
523mg
6%
Folate
44µg
56µg
3%
Vitamin B6
0.137mg
0.119mg
1%
Protein per 100 calories
3.7g
4.3g
N/A
Calories per 10 g protein
274kcal
230kcal
N/A
Weight per 100 calories
17g
26g
N/A
Unsaturated / Saturated Fat ratio
12
3.9
N/A
Net carbs
9.05g
55.67g
N/A
Sugar
4.35g
N/A
Starch
0.72g
0%
Sodium
1mg
2mg
0%
Trans fat
0.015g
N/A
Tryptophan
0.211mg
0.234mg
0%
Threonine
0.601mg
0.575mg
0%
Isoleucine
0.751mg
0.694mg
0%
Leucine
1.473mg
1.284mg
0%
Lysine
0.568mg
0.701mg
0%
Methionine
0.157mg
0.312mg
0%
Phenylalanine
1.132mg
0.895mg
0%
Valine
0.855mg
0.937mg
0%
Histidine
0.539mg
0.405mg
0%
Fructose
0.11g
0%
Omega-3 - ALA
0.003g
N/A
Omega-6 - Eicosadienoic acid
0.002g
N/A
Omega-6 - Linoleic acid
12.32g
N/A
Macronutrient Comparison
Macronutrient breakdown side-by-side comparison
3
21%
50%
22%
4%
3%
Protein:
21.15 g
Fats:
49.93 g
Carbs:
21.55 g
Water:
4.41 g
Other:
2.96 g
2
17%
7%
66%
8%
2%
Protein:
16.89 g
Fats:
6.9 g
Carbs:
66.27 g
Water:
8.22 g
Other:
1.72 g
Contains
more
Protein Protein
+25.2%
Contains
more
Fats Fats
+623.6%
Contains
more
Other Other
+72.1%
Contains
more
Carbs Carbs
+207.5%
Contains
more
Water Water
+86.4%
Fat Type Comparison
Fat type breakdown side-by-side comparison
2
8%
66%
26%
Saturated fat:
Sat. Fat
3.802 g
Monounsaturated fat:
Mono. Fat
31.551 g
Polyunsaturated fat:
Poly. Fat
12.329 g
1
21%
37%
43%
Saturated fat:
Sat. Fat
1.217 g
Monounsaturated fat:
Mono. Fat
2.178 g
Polyunsaturated fat:
Poly. Fat
2.535 g
Contains
more
Mono. Fat Monounsaturated fat
+1348.6%
Contains
more
Poly. Fat Polyunsaturated fat
+386.4%
Contains
less
Sat. Fat Saturated fat
-68%