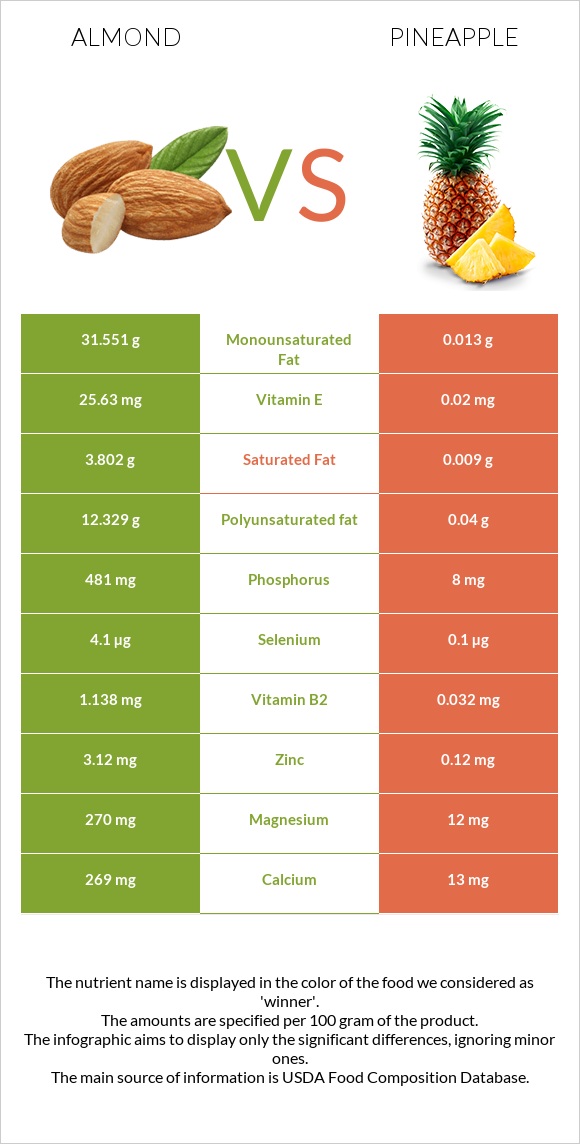
What are the differences between almonds and pineapple? Almonds are higher in vitamin E, copper, vitamin B2, phosphorus, magnesium, manganese, fiber, iron, and zinc, yet pineapple is higher in vitamin C. Almonds' daily need coverage for vitamin E is 171% more. Almonds have 60 times more phosphorus than pineapple. While almonds have 481mg of phosphorus, pineapple has only 8mg. The glycemic index of almonds is lower. We used Nuts, almonds and Pineapple, raw, all varieties types in this article.
Infographic
Mineral Comparison
Mineral comparison score is based on the number of minerals by which one or the other food is richer. The "coverage" charts below show how much of the daily needs can be covered by 300 grams of the food.
9
100 g
300 g
1 almond - 1.2g 1 oz (23 whole kernels) - 28.35g 1 cup, sliced - 92g 1 cup, ground - 95g 1 cup, slivered - 108g 1 cup, whole - 143g
Magnesium
Magnesium
Calcium
Calcium
Potassium
Potassium
Iron
Iron
Copper
Copper
Zinc
Zinc
Phosphorus
Phosphorus
Sodium
Sodium
Manganese
Manganese
Selenium
Selenium
193%
81%
65%
139%
344%
85%
206%
0.13%
284%
22%
0
100 g
300 g
1 slice, thin (3-1/2" dia x 1/2" thick) - 56g 1 slice (3-1/2" dia x 3/4" thick) - 84g 1 cup, chunks - 165g 1 slice (4-2/3" dia x 3/4" thick) - 166g 1 fruit - 905g
Magnesium
Magnesium
Calcium
Calcium
Potassium
Potassium
Iron
Iron
Copper
Copper
Zinc
Zinc
Phosphorus
Phosphorus
Sodium
Sodium
Manganese
Manganese
Selenium
Selenium
8.6%
3.9%
9.6%
11%
37%
3.3%
3.4%
0.13%
121%
0.55%
Vitamin Comparison
Vitamin comparison score is based on the number of vitamins by which one or the other food is richer. The "coverage" charts below show how much of the daily needs can be covered by 300 grams of the food.
7
100 g
300 g
1 almond - 1.2g 1 oz (23 whole kernels) - 28.35g 1 cup, sliced - 92g 1 cup, ground - 95g 1 cup, slivered - 108g 1 cup, whole - 143g
Vitamin C
Vit. C
Vitamin D
Vit. D
Vitamin A
Vit. A
Vitamin E
Vit. E
Vitamin B1
Vit. B1
Vitamin B2
Vit. B2
Vitamin B3
Vit. B3
Vitamin B5
Vit. B5
Vitamin B6
Vit. B6
Vitamin B12
Vit. B12
Vitamin K
Vit. K
Folate
Folate
0%
0%
0%
513%
51%
263%
68%
28%
32%
0%
0%
33%
3
100 g
300 g
1 slice, thin (3-1/2" dia x 1/2" thick) - 56g 1 slice (3-1/2" dia x 3/4" thick) - 84g 1 cup, chunks - 165g 1 slice (4-2/3" dia x 3/4" thick) - 166g 1 fruit - 905g
Vitamin C
Vit. C
Vitamin D
Vit. D
Vitamin A
Vit. A
Vitamin E
Vit. E
Vitamin B1
Vit. B1
Vitamin B2
Vit. B2
Vitamin B3
Vit. B3
Vitamin B5
Vit. B5
Vitamin B6
Vit. B6
Vitamin B12
Vit. B12
Vitamin K
Vit. K
Folate
Folate
159%
0%
1%
0.4%
20%
7.4%
9.4%
13%
26%
0%
1.8%
14%
All nutrients comparison - raw data values
Nutrient
DV% diff.
Vitamin E
25.63mg
0.02mg
171%
Copper
1.031mg
0.11mg
102%
Vitamin B2
1.138mg
0.032mg
85%
Polyunsaturated fat
12.329g
0.04g
82%
Monounsaturated fat
31.551g
0.013g
79%
Fats
49.93g
0.12g
77%
Phosphorus
481mg
8mg
68%
Magnesium
270mg
12mg
61%
Manganese
2.179mg
0.927mg
54%
Vitamin C
0mg
47.8mg
53%
Fiber
12.5g
1.4g
44%
Iron
3.71mg
0.29mg
43%
Protein
21.15g
0.54g
41%
Zinc
3.12mg
0.12mg
27%
Calories
579kcal
50kcal
26%
Calcium
269mg
13mg
26%
Vitamin B3
3.618mg
0.5mg
19%
Potassium
733mg
109mg
18%
Saturated fat
3.802g
0.009g
17%
Vitamin B1
0.205mg
0.079mg
11%
Choline
52.1mg
5.5mg
8%
Selenium
4.1µg
0.1µg
7%
Folate
44µg
18µg
7%
Vitamin B5
0.471mg
0.213mg
5%
Carbs
21.55g
13.12g
3%
Fructose
0.11g
2.12g
3%
Vitamin B6
0.137mg
0.112mg
2%
Vitamin K
0µg
0.7µg
1%
Protein per 100 calories
3.7g
1.1g
N/A
Calories per 10 g protein
274kcal
926kcal
N/A
Weight per 100 calories
17g
200g
N/A
Unsaturated / Saturated Fat ratio
12
5.9
N/A
Net carbs
9.05g
11.72g
N/A
Sugar
4.35g
9.85g
N/A
Starch
0.72g
0g
0%
Sodium
1mg
1mg
0%
Vitamin A
0µg
3µg
0%
Trans fat
0.015g
0g
N/A
Tryptophan
0.211mg
0.005mg
0%
Threonine
0.601mg
0.019mg
0%
Isoleucine
0.751mg
0.019mg
0%
Leucine
1.473mg
0.024mg
0%
Lysine
0.568mg
0.026mg
0%
Methionine
0.157mg
0.012mg
0%
Phenylalanine
1.132mg
0.021mg
0%
Valine
0.855mg
0.024mg
0%
Histidine
0.539mg
0.01mg
0%
Omega-3 - ALA
0.003g
N/A
Omega-6 - Eicosadienoic acid
0.002g
N/A
Omega-6 - Linoleic acid
12.32g
N/A
Macronutrient Comparison
Macronutrient breakdown side-by-side comparison
4
21%
50%
22%
4%
3%
Protein:
21.15 g
Fats:
49.93 g
Carbs:
21.55 g
Water:
4.41 g
Other:
2.96 g
1
13%
86%
Protein:
0.54 g
Fats:
0.12 g
Carbs:
13.12 g
Water:
86 g
Other:
0.22 g
Contains
more
Protein Protein
+3816.7%
Contains
more
Fats Fats
+41508.3%
Contains
more
Carbs Carbs
+64.3%
Contains
more
Other Other
+1245.5%
Contains
more
Water Water
+1850.1%
Fat Type Comparison
Fat type breakdown side-by-side comparison
2
8%
66%
26%
Saturated fat:
Sat. Fat
3.802 g
Monounsaturated fat:
Mono. Fat
31.551 g
Polyunsaturated fat:
Poly. Fat
12.329 g
1
15%
21%
65%
Saturated fat:
Sat. Fat
0.009 g
Monounsaturated fat:
Mono. Fat
0.013 g
Polyunsaturated fat:
Poly. Fat
0.04 g
Contains
more
Mono. Fat Monounsaturated fat
+242600%
Contains
more
Poly. Fat Polyunsaturated fat
+30722.5%
Contains
less
Sat. Fat Saturated fat
-99.8%
Carbohydrate type comparison
Carbohydrate type breakdown side-by-side comparison
3
14%
78%
3%
2%
Starch:
0.72 g
Sucrose:
3.95 g
Glucose:
0.17 g
Fructose:
0.11 g
Lactose:
0 g
Maltose:
0.04 g
Galactose:
0.07 g
3
61%
18%
22%
Starch:
0 g
Sucrose:
5.99 g
Glucose:
1.73 g
Fructose:
2.12 g
Lactose:
0 g
Maltose:
0 g
Galactose:
0 g
Contains
more
Starch Starch
+∞%
Contains
more
Maltose Maltose
+∞%
Contains
more
Galactose Galactose
+∞%
Contains
more
Sucrose Sucrose
+51.6%
Contains
more
Glucose Glucose
+917.6%
Contains
more
Fructose Fructose
+1827.3%