Pineapple Nutrition & Calories - Complete data of all nutrients

Summary
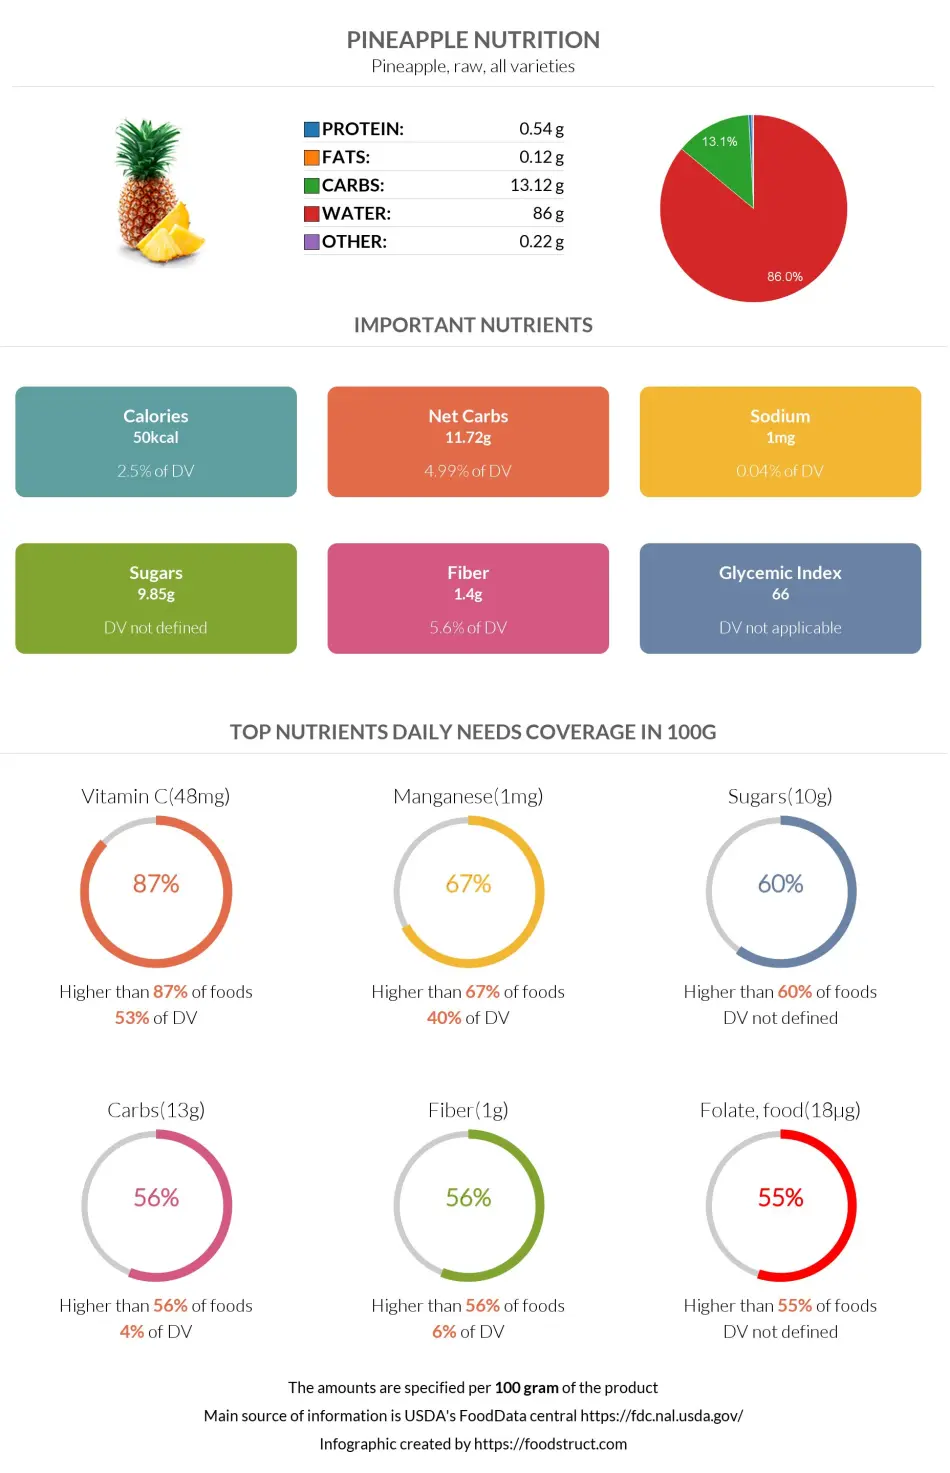
Pineapple is over 85% water and 14% carbohydrates (mostly net carbs), with very little protein and fats.
From micronutrients, pineapple is a good source of vitamin C and manganese.
Canned pineapple contains 5 times less vitamin C than fresh pineapple.
Pineapple is a great source of phytochemicals and enzymes that have been found to have various beneficial effects on health.
Introduction
Pineapple is a tropical fruit otherwise known as ananas or Ananas comosus. It’s also a multiple or collective fruit, meaning that the fruit is formed from carpels derived from several flowers.
Nutrition
This article focuses on the nutrition of raw pineapples of all varieties. Pineapple juice, canned pineapple, and extra-sweet variety of pineapple are similar to the pineapple fruit in their nutritional contents; however, relatively significant differences will be mentioned in this article (1, 2).
Pineapple is made up of mainly water and carbohydrates.
Macronutrients chart
Serving Size
The average serving size of pineapple is one cup, in chunks, weighing ~165g.
One whole pineapple fruit weighs about 905g, while one average slice of pineapple is said to be 84g.
Calories
Pineapple is low in calories. A 100-gramerving of pineapple provides 50 calories; consequently, one serving of pineapple provides 82.5 calories.
Pineapple is in the top 15% of foods low in calories.
What Does 50 Calories or 100 Grams of Pineapple Look Like?
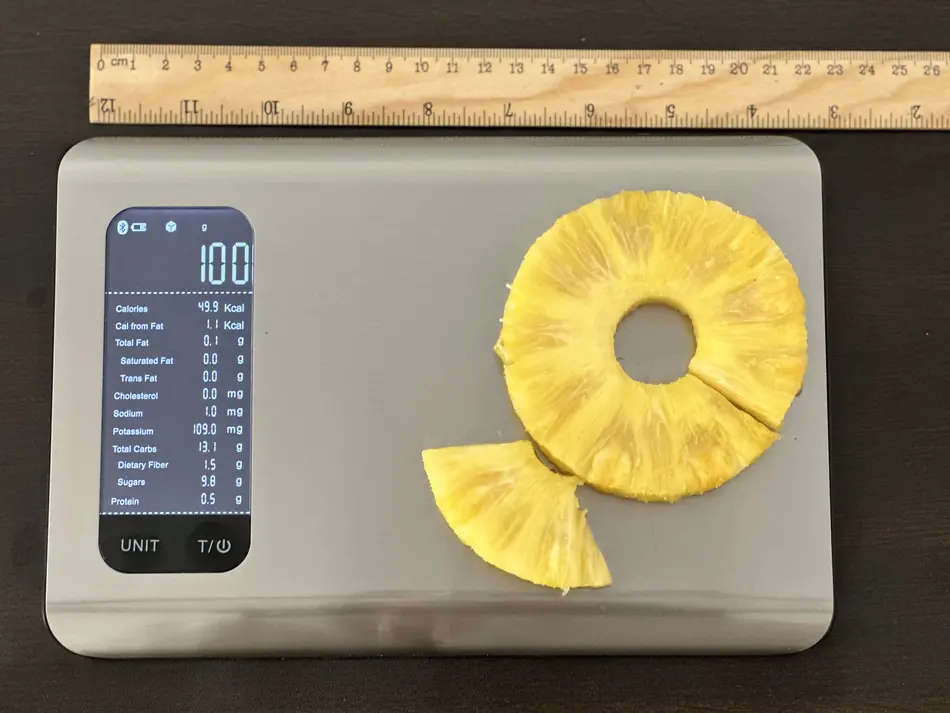
Our team measured what 100 grams of pineapple looks like to help you visualize its weight and calories. As you can see from the picture, about one and a half slices of pineapple comprised the entire 100 grams (50 calories).
Note that depending on the pineapple's size and ripeness, calories may differ for you.
Carbohydrates
The predominant macronutrients in pineapple are carbs.
A 100g of pineapple contains 13.1g of carbs, whereas one serving of pineapple contains 21.6g of carbs.
The average serving size of the fruit covers only 7% of the daily carb need.
Net Carbs
As mentioned above, pineapple contains 13.12g of carbs, from which 11.72g or 89% are net carbs, and 1.4g or 11% is dietary fiber.
The sugars found in all types of pineapples are sucrose, glucose, and fructose, but in different percentages. Pineapple and extra-sweet pineapple are the highest in sucrose, whereas canned pineapple and pineapple juice contain glucose and fructose primarily.
Carbohydrate type breakdown
Dietary Fiber
A 100g of pineapple contains 1.4g of dietary fiber, whereas one serving of pineapple contains 2.31g of dietary fiber.
Pineapple is not a particularly good source of dietary fiber, as a 100g serving of this fruit covers only 6% of the daily needed value of this nutrient.
Extra-sweet pineapple contains the same amount of dietary fiber as the regular one, whereas pineapple juice and canned pineapple contain 7 and 1.75 times less fiber, respectively.
Different varieties of pineapple slightly differ in their fiber contents. However, according to different studies, pineapple fibers are predominantly insoluble - from 82 to 97% (3, 4, 5).
Fiber content ratio for Pineapple
Protein
Pineapple is very low in protein. One serving of pineapple covers 1.8% of the daily protein needed.
A 100g of pineapple contains 0.54g of proteins, and one serving of pineapple contains 0.9g of proteins.
Pineapple is relatively richer in essential amino acids lysine, leucine, and valine and lower in tryptophan.
Protein quality breakdown
Fats
Pineapple contains an insignificant amount of fats: 0.12g in 100g and 0.2g in one serving of pineapple. One serving of pineapple covers only 0.3% of the daily value of fat.
Fat type information
Vitamins
Pineapple contains most vitamins, but it is considered a great source only of vitamin C. A 100g of pineapple covers 53%, and one serving of pineapple covers 88% of the daily need for vitamin C.
Canned pineapple contains 5 times less vitamin C than fresh pineapple.
Vitamin C is widely known for its ability to boost immunity and scavenge harmful free radicals, acting as a strong antioxidant.
As for the other vitamins, 100g of the fruit covers less than 10% of the need for each.
Pineapple is relatively higher in vitamins A and B6, vitamin B1 or thiamine, and vitamin B9 or folate.
The extra-sweet pineapple, pineapple juice, and canned pineapple are lower in all vitamins in comparison.
Pineapple is naturally absent in vitamin B12 and vitamin D.
Vitamin coverage chart
Minerals
Pineapple has some levels of all minerals but in small quantities.
One serving of pineapple covers 76.5% of the daily manganese needed. Other than that, pineapple is not rich in any other mineral.
However, it is relatively higher in copper and calcium and is very low in phosphorus and sodium.
Mineral coverage chart
Fluoride
Pineapple juice and canned pineapple contain a mineral called fluoride too. The fluoride content in these pineapple products exceeds the recommended amount for all ages and sexes but not as much for teens and adults.
Fluoride protects against tooth decay and bone fractures; however, getting too much fluoride for a long time may lead to adverse health effects, such as skeletal fluorosis. The symptoms of this very rare condition can be joint pain and stiffness, weak bones, muscle loss, and nerve problems (6).
However, the upper limit of fluoride intake is 10mg for adults and children over 9, while a 100g serving of canned pineapple provides only 0.0042mg of fluoride.
Acute fluoride poisoning can cause abdominal pain, nausea, vomiting, and diarrhea; however, this is extremely unlikely to happen due to pineapple consumption, even in large quantities.
Sodium
Pineapple, canned pineapple, and pineapple juice are incredibly low in sodium.
Pineapple contains only 1 mg of sodium.
2020-2025 Dietary Guidelines for Americans recommend consuming less than 2.3g of sodium per day (7).
Phytochemicals
Phenolic Compounds
Pineapple is a good source of phenolic compounds, such as flavonoids (coumaric acid, ellagic acid, ferulic and chlorogenic acids). Flavonoids have many health-promoting effects due to their anti-inflammatory, antioxidant, anti-mutagenic, and anti-cholinesterase activities. Flavonoids reduce the risk of cancer, atherosclerosis, heart, and degenerative nerve disease (8, 9).
Enzymes
Bromelain
Bromelain from pineapple is a mixture of enzymes with proteolytic activity. Some people have lip and tongue irritation after consuming pineapple caused by bromelain.
Bromelain supplements have various health benefits, protecting against inflammation and cancer and their ability to induce apoptotic cell death and reduce swelling. Bromelain is also associated with analgesic or pain-relieving effects and has properties similar to blood thinners (10, 11).
Bromelain can also enhance the absorption of drugs, particularly antibiotics, improve digestion by relieving diarrhea and be beneficial for people with osteoarthritis (10).
Glycemic Index
The glycemic index of pineapple varies depending on the variety of the fruit. Nevertheless, most of the numbers fall into the medium glycemic index category.
For example, according to one study, pineapple from the Philippines has a medium glycemic index value of 65, but according to another one, it has a low glycemic index value of 51.
Pineapple's average glycemic index value can be considered 59 ± 8. (12,13).
If you are interested in the glycemic index values of different foods, you can visit our Glycemic index chart - Complete (350+) list from all sources page.
Acidity
Pineapple, pineapple juice, and canned pineapple are considered very acidic.
The pH value of pineapple varies from 3.20 to 4.00. The pH value of pineapple juice varies from 3.30 to 3.60, and canned pineapple - varies from 3.35 to 4.10 (14).
The PRAL or potential renal acid value shows how much base or acid is produced in the organism by the given food. The PRAL values of pineapple and pineapple juice are -2.2 and -2.7, respectively, making them base-producing foods.
Comparison to Similar Foods
Compared to oranges, pineapple is slightly higher in net carbs and calories, whereas orange is slightly richer in protein and fiber. But for juices - orange juice is slightly higher in net carbs and calories, whereas pineapple juice is slightly richer in protein. Both are equally very low in dietary fiber.
You can visit our “Pineapple vs. Orange” and “Orange juice vs. Pineapple juice” pages for in-depth comparisons.
Compared to apples, pineapple is slightly higher in net carbs and protein, whereas apple is slightly richer in fats and calories.
You can find more information about their differences on our “Apple vs. Pineapple” page.
Compared to bananas, pineapple is richer in vitamin C and manganese, while bananas are a better source of vitamin B6 and potassium.
More information can be found on our “Bananas vs. Pineapples” page.
References
- https://fdc.nal.usda.gov/fdc-app.html#/food-details/168194/nutrients
- https://fdc.nal.usda.gov/fdc-app.html#/food-details/169126/nutrients
- https://www.ncbi.nlm.nih.gov/pmc/articles/PMC3614039/
- Total, insoluble and soluble dietary fiber contents of Indian fruits
- https://www.ars.usda.gov/arsuserfiles/80400525/articles/jfca15_715-723.pdf
- https://ods.od.nih.gov/factsheets/Fluoride-Consumer/
- Salt | cdc.gov
- https://www.ncbi.nlm.nih.gov/pmc/articles/PMC7824113/
- https://www.ncbi.nlm.nih.gov/pmc/articles/PMC5465813/
- https://www.ncbi.nlm.nih.gov/pmc/articles/PMC3529416/
- https://pubmed.ncbi.nlm.nih.gov/26518672/
- https://www.nature.com/articles/s41387-020-00145-w.pdf
- https://academic.oup.com/ajcn/article/76/1/5/4689459
- pH values of foods and food products

Top nutrition facts for Pineapple
| Calories ⓘ Calories for selected serving | 50 kcal |
| Net carbs ⓘ Net Carbs = Total Carbohydrates – Fiber – Sugar Alcohols | 12 g |
| Vitamin C | 47.8 mg |
| Manganese | 0.927 mg |
|
Glycemic index ⓘ
Source:
19 in this study https://www.cabdirect.org/globalhealth/abstract/20123409459 56 in this one https://www.sciencedirect.com/science/article/pii/S235261811500027X 80 in here https://www.imedpub.com/articles/glycemic-index-of-some-traditional-fruits-in-jamaic
Check out our Glycemic index chart page for the full list.
|
66 (medium) |
| Default serving size ⓘ Serving sizes are mostly taken from FDA's Reference Amounts Customarily Consumed (RACCs) | 1 cup, chunks (165 g) |
Pineapple calories (kcal)
| Calories for different serving sizes of pineapple | Calories | Weight |
|---|---|---|
| Calories in 100 grams | 50 | |
| Calories in 1 cup, chunks | 83 | 165 g |
| Calories in 1 fruit | 453 | 905 g |
Extra Nutrition facts for Pineapple
| Protein per 100 calories ⓘ Shows how many grams of protein you get from 100 calories of this food, calculated as (protein in g ÷ calories) × 100. | 1.1 g |
| Calories per 10 g protein ⓘ Shows how many calories you need to eat from this food to get 10 g of protein, calculated as (calories ÷ protein in g) × 10. | 926 kcal |
| Weight per 100 calories ⓘ Shows how many grams of this food equal 100 kcal—higher grams mean a larger portion for the same calories. | 200 g |
| Acidity (Based on PRAL) ⓘ PRAL (Potential renal acid load) is calculated using a formula. On the PRAL scale the higher the positive value, the more is the acidifying effect on the body. The lower the negative value, the higher the alkalinity of the food. 0 is neutral. | -2.2 (alkaline) |
| Oxalates | 5 mg ⓘ https://www.researchgate.net/publication/259133562 |
| Quercetin | 0.2 mg ⓘ https://www.researchgate.net/publication/391558000 |
| Catechin | 15 mg ⓘ https://www.researchgate.net/publication/391558000 |
| Ferulic acid | 4.1 mcg ⓘ https://www.researchgate.net/publication/391558000 |
| Caffeic acid | 0.2 mcg ⓘ https://www.researchgate.net/publication/391558000 |
| Rutin | 1.5 mcg ⓘ https://www.researchgate.net/publication/343558334 |
| p-Coumaric acid | 0.08 mg ⓘ https://www.researchgate.net/publication/391558000 |
| Gallic acid | 12.4 mg ⓘ https://www.researchgate.net/publication/391558000 |
| Total phenolic content | 1720 mg GAE ⓘ https://journal.ugm.ac.id/v3/jtbb/article/view/16490/5905 |
| Kaempferol | 0.07 mg ⓘ https://www.researchgate.net/publication/391558000 |
| Chlorine | 320 mg ⓘ https://journal.ugm.ac.id/v3/jtbb/article/view/16490/5905 |
| Total flavonoid content | 500 mg/QE ⓘ https://journal.ugm.ac.id/v3/jtbb/article/view/16490/5905 |
| Syringic acid | 0.2 mg ⓘ https://www.researchgate.net/publication/391558000 |
| Processing score ⓘ The processing score is a calculated value that looks at both how industrially made it is (NOVA) and how healthy/unprocessed the ingredients are (SIGA), then combines them into one score from 1 (least processed) to 4 (most processed). | 1 - Unprocessed ⓘ NOVA score = 1, SIGA score = A0 |
Pineapple Glycemic index (GI)
Pineapple Glycemic load (GL)
Mineral chart - relative view
Vitamin chart - relative view
All nutrients for Pineapple per 100g
| Nutrient | Value | DV% | In TOP % of foods | Comparison |
| Vitamin A | 3µg | 0% | 45% | |
| Calories | 50kcal | 3% | 88% |
1.1 times more than Orange
|
| Protein per 100 calories | 1.1g | N/A | 85% | |
| Calories per 10 g protein | 926kcal | N/A | 12% | |
| Weight per 100 calories | 200g | N/A | 13% | |
| Protein | 0.54g | 1% | 90% |
5.2 times less than Broccoli
|
| Fats | 0.12g | 0% | 91% |
277.6 times less than Cheese
|
| Vitamin C | 48mg | 53% | 4% |
1.1 times less than Lemon
|
| Carbs | 13g | 4% | 44% |
2.1 times less than Rice
|
| Net carbs | 12g | N/A | 43% |
4.6 times less than Chocolate
|
| Cholesterol | 0mg | 0% | 100% |
N/A
|
| Vitamin D | 0µg | 0% | 100% |
N/A
|
| Vitamin D* | 0 IU | 0% | 100% |
N/A
|
| Magnesium | 12mg | 3% | 72% |
11.7 times less than Almonds
|
| Calcium | 13mg | 1% | 65% |
9.6 times less than Milk
|
| Potassium | 109mg | 3% | 76% |
1.3 times less than Cucumber
|
| Iron | 0.29mg | 4% | 84% |
9 times less than Beef broiled
|
| Sugar | 9.9g | N/A | 19% |
1.1 times more than Coca-Cola
|
| Fiber | 1.4g | 6% | 38% |
1.7 times less than Orange
|
| Copper | 0.11mg | 12% | 34% |
1.3 times less than Shiitake
|
| Zinc | 0.12mg | 1% | 81% |
52.6 times less than Beef broiled
|
| Starch | 0g | 0% | 100% |
N/A
|
| Phosphorus | 8mg | 1% | 88% |
22.8 times less than Chicken meat
|
| Sodium | 1mg | 0% | 97% |
490 times less than White bread
|
| Vitamin E | 0.02mg | 0% | 61% |
73 times less than Kiwi
|
| Manganese | 0.93mg | 40% | 9% | |
| Selenium | 0.1µg | 0% | 77% | |
| Vitamin B1 | 0.08mg | 7% | 50% |
3.4 times less than Pea raw
|
| Vitamin B2 | 0.03mg | 2% | 80% |
4.1 times less than Avocado
|
| Vitamin B3 | 0.5mg | 3% | 72% |
19.1 times less than Turkey meat
|
| Vitamin B5 | 0.21mg | 4% | 55% |
5.3 times less than Sunflower seeds
|
| Vitamin B6 | 0.11mg | 9% | 52% |
1.1 times less than Oats
|
| Vitamin B12 | 0µg | 0% | 100% |
N/A
|
| Vitamin K | 0.7µg | 1% | 39% |
145.1 times less than Broccoli
|
| Trans fat | 0g | N/A | 100% |
N/A
|
| Folate | 18µg | 5% | 36% |
3.4 times less than Brussels sprouts
|
| Saturated fat | 0.01g | 0% | 90% |
655 times less than Beef broiled
|
| Choline | 5.5mg | 1% | 46% | |
| Monounsaturated fat | 0.01g | N/A | 84% |
753.8 times less than Avocado
|
| Polyunsaturated fat | 0.04g | N/A | 84% |
1179.4 times less than Walnut
|
| Tryptophan | 0.01mg | 0% | 56% |
61 times less than Chicken meat
|
| Threonine | 0.02mg | 0% | 56% |
37.9 times less than Beef broiled
|
| Isoleucine | 0.02mg | 0% | 56% |
48.1 times less than Salmon raw
|
| Leucine | 0.02mg | 0% | 57% |
101.3 times less than Tuna Bluefin
|
| Lysine | 0.03mg | 0% | 56% |
17.4 times less than Tofu
|
| Methionine | 0.01mg | 0% | 54% |
8 times less than Quinoa
|
| Phenylalanine | 0.02mg | 0% | 56% |
31.8 times less than Egg
|
| Valine | 0.02mg | 0% | 56% |
84.5 times less than Soybean raw
|
| Histidine | 0.01mg | 0% | 56% |
74.9 times less than Turkey meat
|
| Fructose | 2.1g | 3% | 4% |
2.8 times less than Apple
|
| Caffeine | 0mg | 0% | 100% | |
| Omega-3 - EPA | 0g | N/A | 100% |
N/A
|
| Omega-3 - DHA | 0g | N/A | 100% |
N/A
|
| Omega-3 - DPA | 0g | N/A | 100% |
N/A
|
Check out similar food or compare with current
NUTRITION FACTS LABEL
Serving Size ______________
Health checks
Pineapple nutrition infographic
References
All the values for which the sources are not specified explicitly are taken from FDA’s Food Central. The exact link to the food presented on this page can be found below.