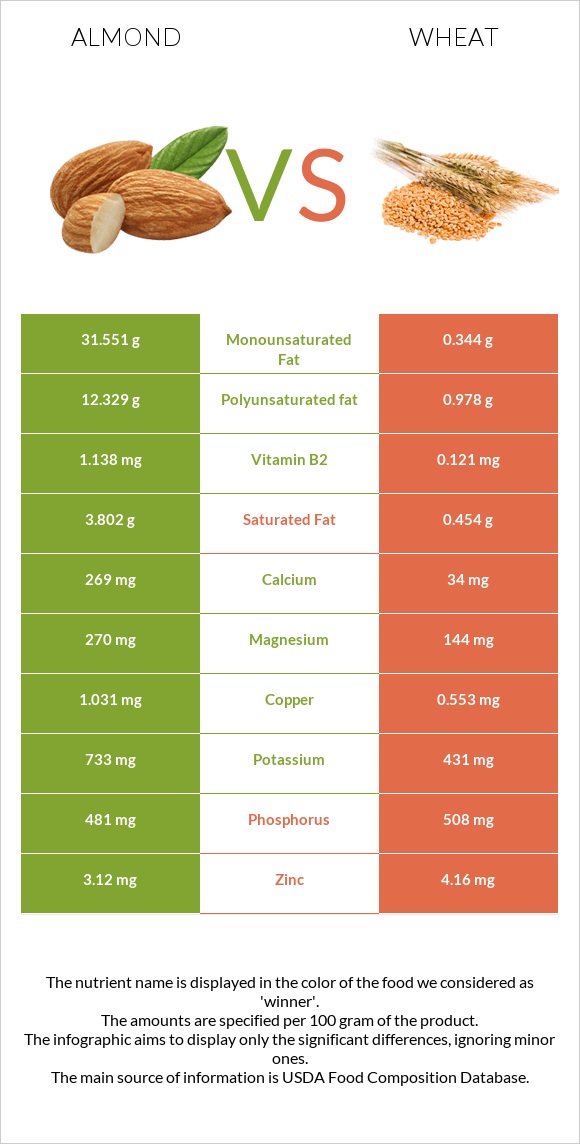
Significant differences between almonds and wheat Almonds have more vitamin E, copper, vitamin B2, magnesium, manganese, phosphorus, fiber, calcium, and iron; however, wheat is richer in selenium. Almonds cover your daily vitamin E needs 169% more than wheat. Wheat has 38 times less vitamin B2 than almonds. Almonds have 1.138mg of vitamin B2, while wheat has 0.03mg. Wheat has a higher glycemic index. The glycemic index of wheat is 50, while the glycemic index of almonds is 0. Specific food types used in this comparison are Nuts, almonds and Wheat, KAMUT khorasan, cooked .
Infographic
Mineral Comparison
Mineral comparison score is based on the number of minerals by which one or the other food is richer. The "coverage" charts below show how much of the daily needs can be covered by 300 grams of the food.
9
100 g
300 g
1 almond - 1.2g 1 oz (23 whole kernels) - 28.35g 1 cup, sliced - 92g 1 cup, ground - 95g 1 cup, slivered - 108g 1 cup, whole - 143g
Magnesium
Magnesium
Calcium
Calcium
Potassium
Potassium
Iron
Iron
Copper
Copper
Zinc
Zinc
Phosphorus
Phosphorus
Sodium
Sodium
Manganese
Manganese
Selenium
Selenium
193%
81%
65%
139%
344%
85%
206%
0.13%
284%
22%
1
100 g
300 g
1 cup - 172g
Magnesium
Magnesium
Calcium
Calcium
Potassium
Potassium
Iron
Iron
Copper
Copper
Zinc
Zinc
Phosphorus
Phosphorus
Sodium
Sodium
Manganese
Manganese
Selenium
Selenium
34%
2.7%
14%
66%
69%
50%
63%
1%
134%
174%
Vitamin Comparison
Vitamin comparison score is based on the number of vitamins by which one or the other food is richer. The "coverage" charts below show how much of the daily needs can be covered by 300 grams of the food.
7
100 g
300 g
1 almond - 1.2g 1 oz (23 whole kernels) - 28.35g 1 cup, sliced - 92g 1 cup, ground - 95g 1 cup, slivered - 108g 1 cup, whole - 143g
Vitamin C
Vit. C
Vitamin D
Vit. D
Vitamin A
Vit. A
Vitamin E
Vit. E
Vitamin B1
Vit. B1
Vitamin B2
Vit. B2
Vitamin B3
Vit. B3
Vitamin B5
Vit. B5
Vitamin B6
Vit. B6
Vitamin B12
Vit. B12
Vitamin K
Vit. K
Folate
Folate
0%
0%
0%
513%
51%
263%
68%
28%
32%
0%
0%
33%
0
100 g
300 g
1 cup - 172g
Vitamin C
Vit. C
Vitamin D
Vit. D
Vitamin A
Vit. A
Vitamin E
Vit. E
Vitamin B1
Vit. B1
Vitamin B2
Vit. B2
Vitamin B3
Vit. B3
Vitamin B5
Vit. B5
Vitamin B6
Vit. B6
Vitamin B12
Vit. B12
Vitamin K
Vit. K
Folate
Folate
0%
0%
0%
4.8%
24%
6.9%
43%
0%
16%
0%
0%
8.3%
All nutrients comparison - raw data values
Nutrient
DV% diff.
Vitamin E
25.63mg
0.24mg
169%
Copper
1.031mg
0.207mg
92%
Vitamin B2
1.138mg
0.03mg
85%
Polyunsaturated fat
12.329g
0.243g
81%
Monounsaturated fat
31.551g
0.084g
79%
Fats
49.93g
0.83g
76%
Magnesium
270mg
48mg
53%
Selenium
4.1µg
31.9µg
51%
Manganese
2.179mg
1.03mg
50%
Phosphorus
481mg
147mg
48%
Fiber
12.5g
4.3g
33%
Protein
21.15g
5.71g
31%
Calcium
269mg
9mg
26%
Iron
3.71mg
1.76mg
24%
Calories
579kcal
132kcal
22%
Potassium
733mg
164mg
17%
Saturated fat
3.802g
0.077g
17%
Zinc
3.12mg
1.84mg
12%
Vitamin B1
0.205mg
0.095mg
9%
Vitamin B5
0.471mg
9%
Choline
52.1mg
9%
Vitamin B3
3.618mg
2.305mg
8%
Folate
44µg
11µg
8%
Vitamin B6
0.137mg
0.07mg
5%
Carbs
21.55g
27.6g
2%
Protein per 100 calories
3.7g
4.3g
N/A
Calories per 10 g protein
274kcal
231kcal
N/A
Weight per 100 calories
17g
76g
N/A
Unsaturated / Saturated Fat ratio
12
4.2
N/A
Net carbs
9.05g
23.3g
N/A
Sugar
4.35g
3.07g
N/A
Starch
0.72g
0%
Sodium
1mg
8mg
0%
Trans fat
0.015g
0.002g
N/A
Tryptophan
0.211mg
0.051mg
0%
Threonine
0.601mg
0.172mg
0%
Isoleucine
0.751mg
0.22mg
0%
Leucine
1.473mg
0.432mg
0%
Lysine
0.568mg
0.161mg
0%
Methionine
0.157mg
0.097mg
0%
Phenylalanine
1.132mg
0.3mg
0%
Valine
0.855mg
0.267mg
0%
Histidine
0.539mg
0.147mg
0%
Fructose
0.11g
0%
Omega-3 - ALA
0.003g
N/A
Omega-6 - Eicosadienoic acid
0.002g
N/A
Omega-6 - Linoleic acid
12.32g
N/A
Macronutrient Comparison
Macronutrient breakdown side-by-side comparison
3
21%
50%
22%
4%
3%
Protein:
21.15 g
Fats:
49.93 g
Carbs:
21.55 g
Water:
4.41 g
Other:
2.96 g
2
6%
28%
65%
Protein:
5.71 g
Fats:
0.83 g
Carbs:
27.6 g
Water:
65.18 g
Other:
0.68 g
Contains
more
Protein Protein
+270.4%
Contains
more
Fats Fats
+5915.7%
Contains
more
Other Other
+335.3%
Contains
more
Carbs Carbs
+28.1%
Contains
more
Water Water
+1378%
Fat Type Comparison
Fat type breakdown side-by-side comparison
2
8%
66%
26%
Saturated fat:
Sat. Fat
3.802 g
Monounsaturated fat:
Mono. Fat
31.551 g
Polyunsaturated fat:
Poly. Fat
12.329 g
1
19%
21%
60%
Saturated fat:
Sat. Fat
0.077 g
Monounsaturated fat:
Mono. Fat
0.084 g
Polyunsaturated fat:
Poly. Fat
0.243 g
Contains
more
Mono. Fat Monounsaturated fat
+37460.7%
Contains
more
Poly. Fat Polyunsaturated fat
+4973.7%
Contains
less
Sat. Fat Saturated fat
-98%